Category: Urbanism
-
Updates to Australian Cycleway Stats
Australian Cycleway Stats now compares cycleway length per resident and per sq/km – comparing Australian councils with world-leading cities. This tool remains AGPLv3 open-source.
-
Introducing the Cooks River Catchment Map for the Cooks River Alliance
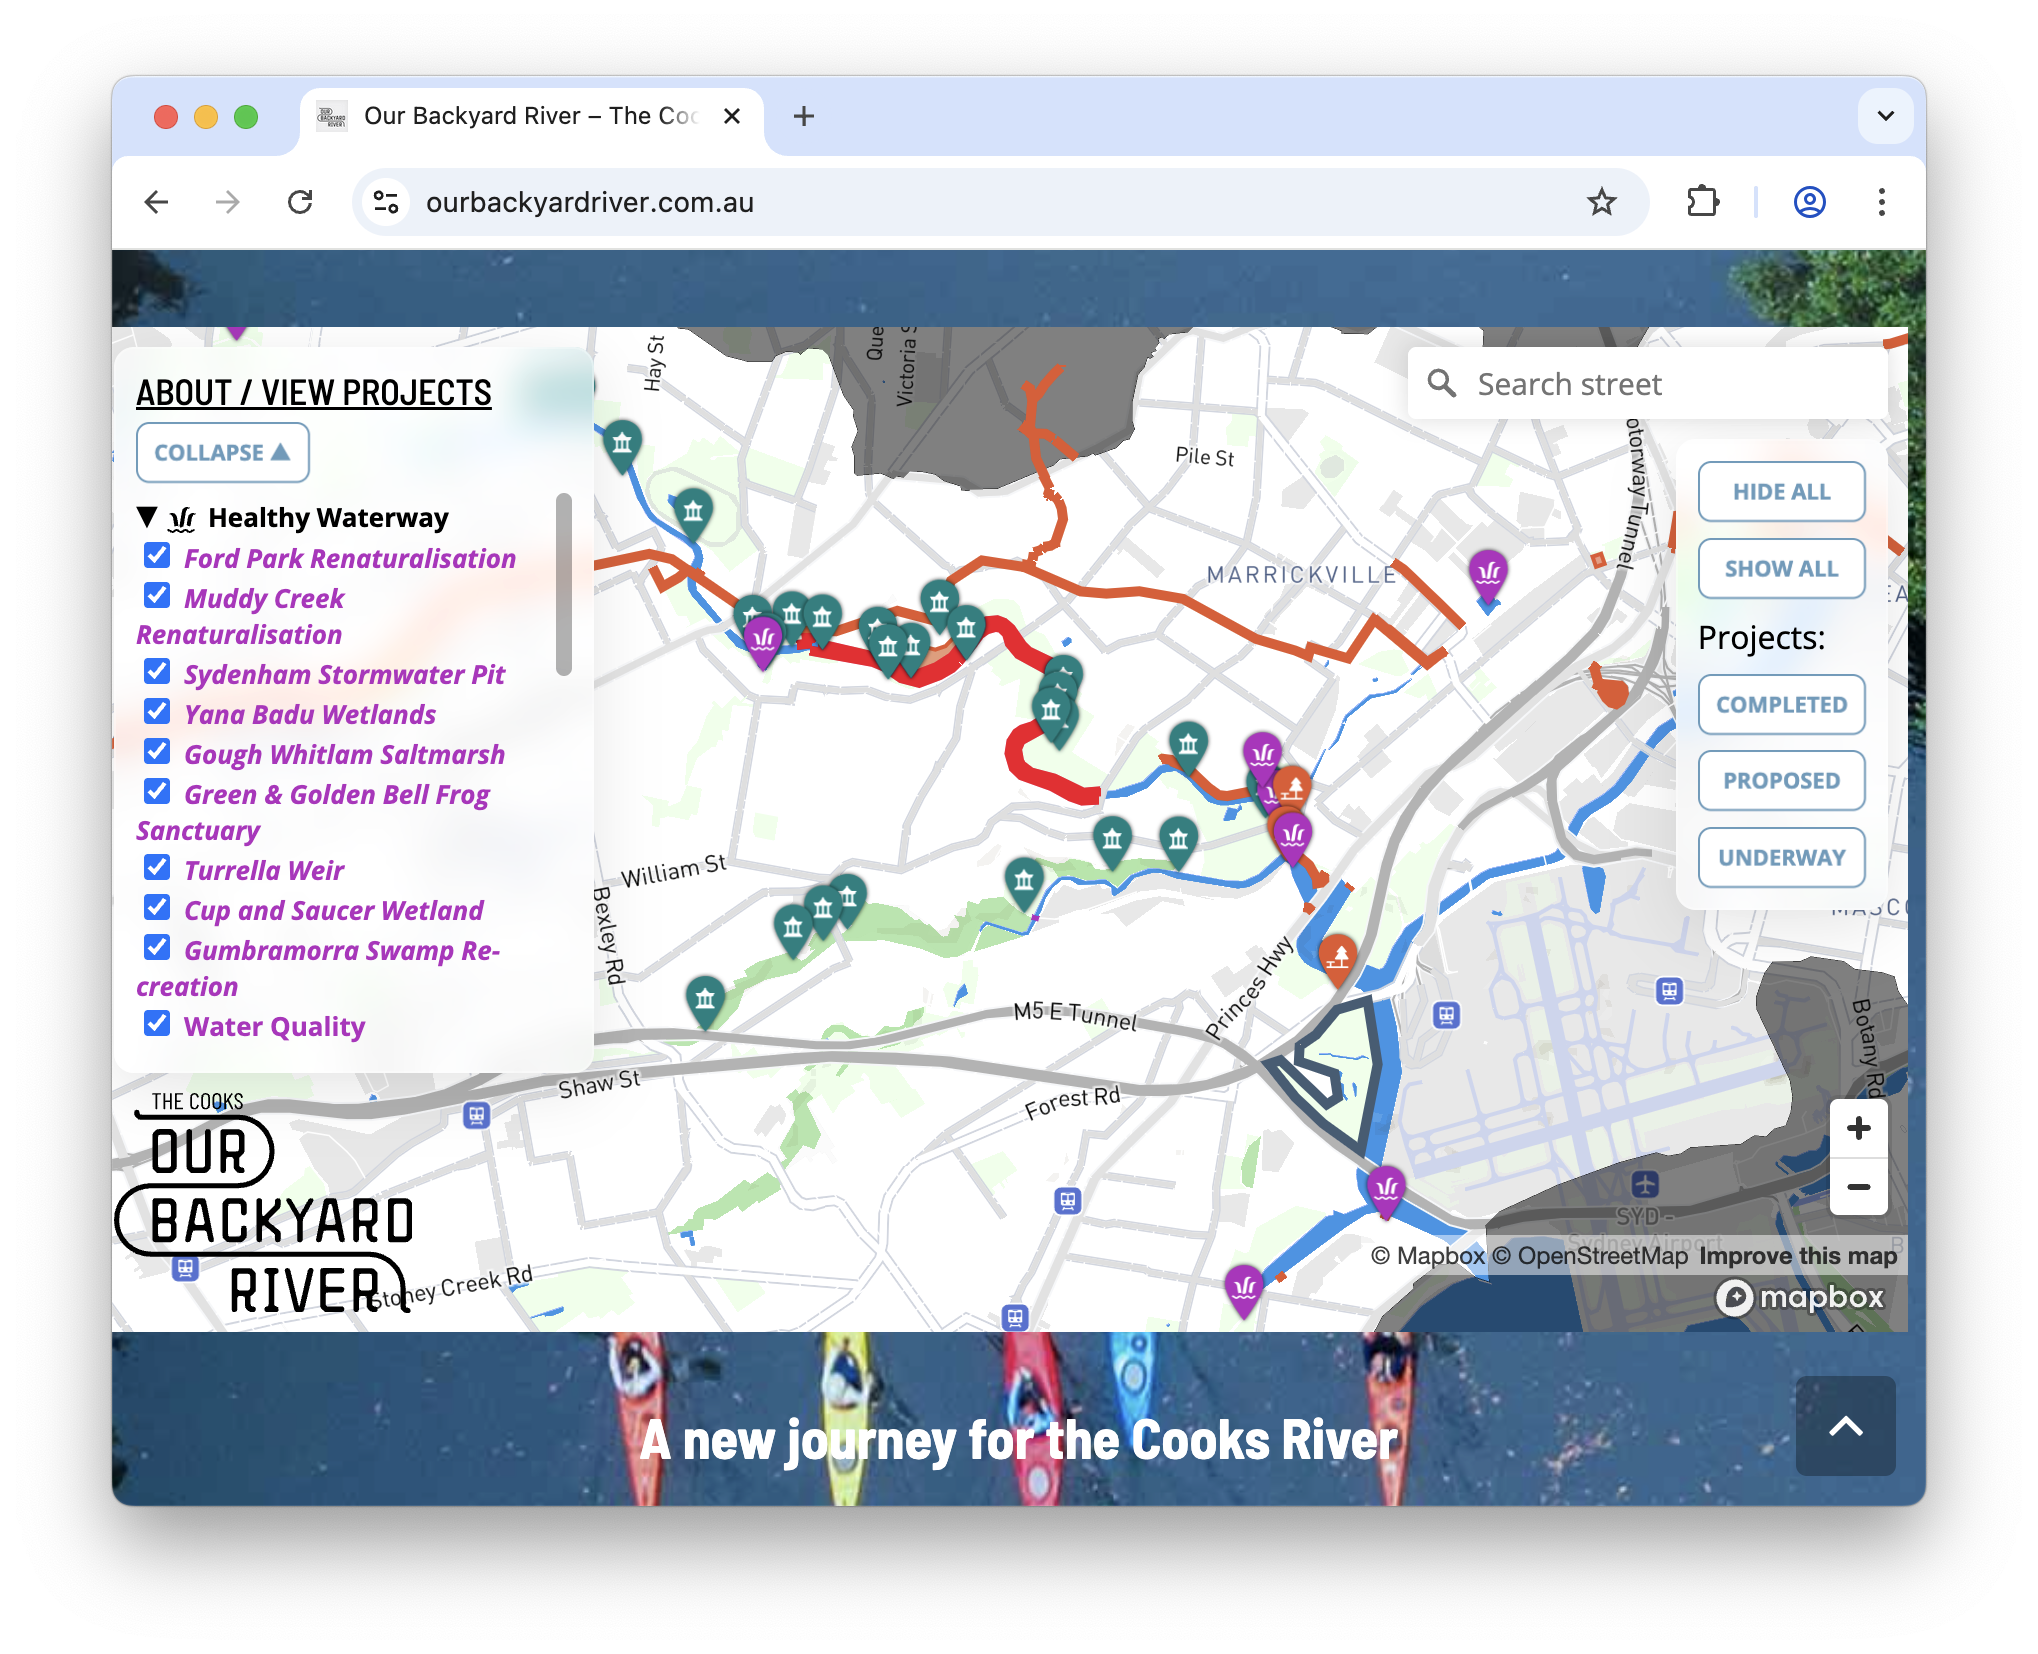
I’m pleased to share the completion of a recent commercial engagement by UrbanSpectra in collaboration with the Cooks River Alliance: the Cooks River Catchment Map.
-
Have you heard of the Southern Arterial Route?
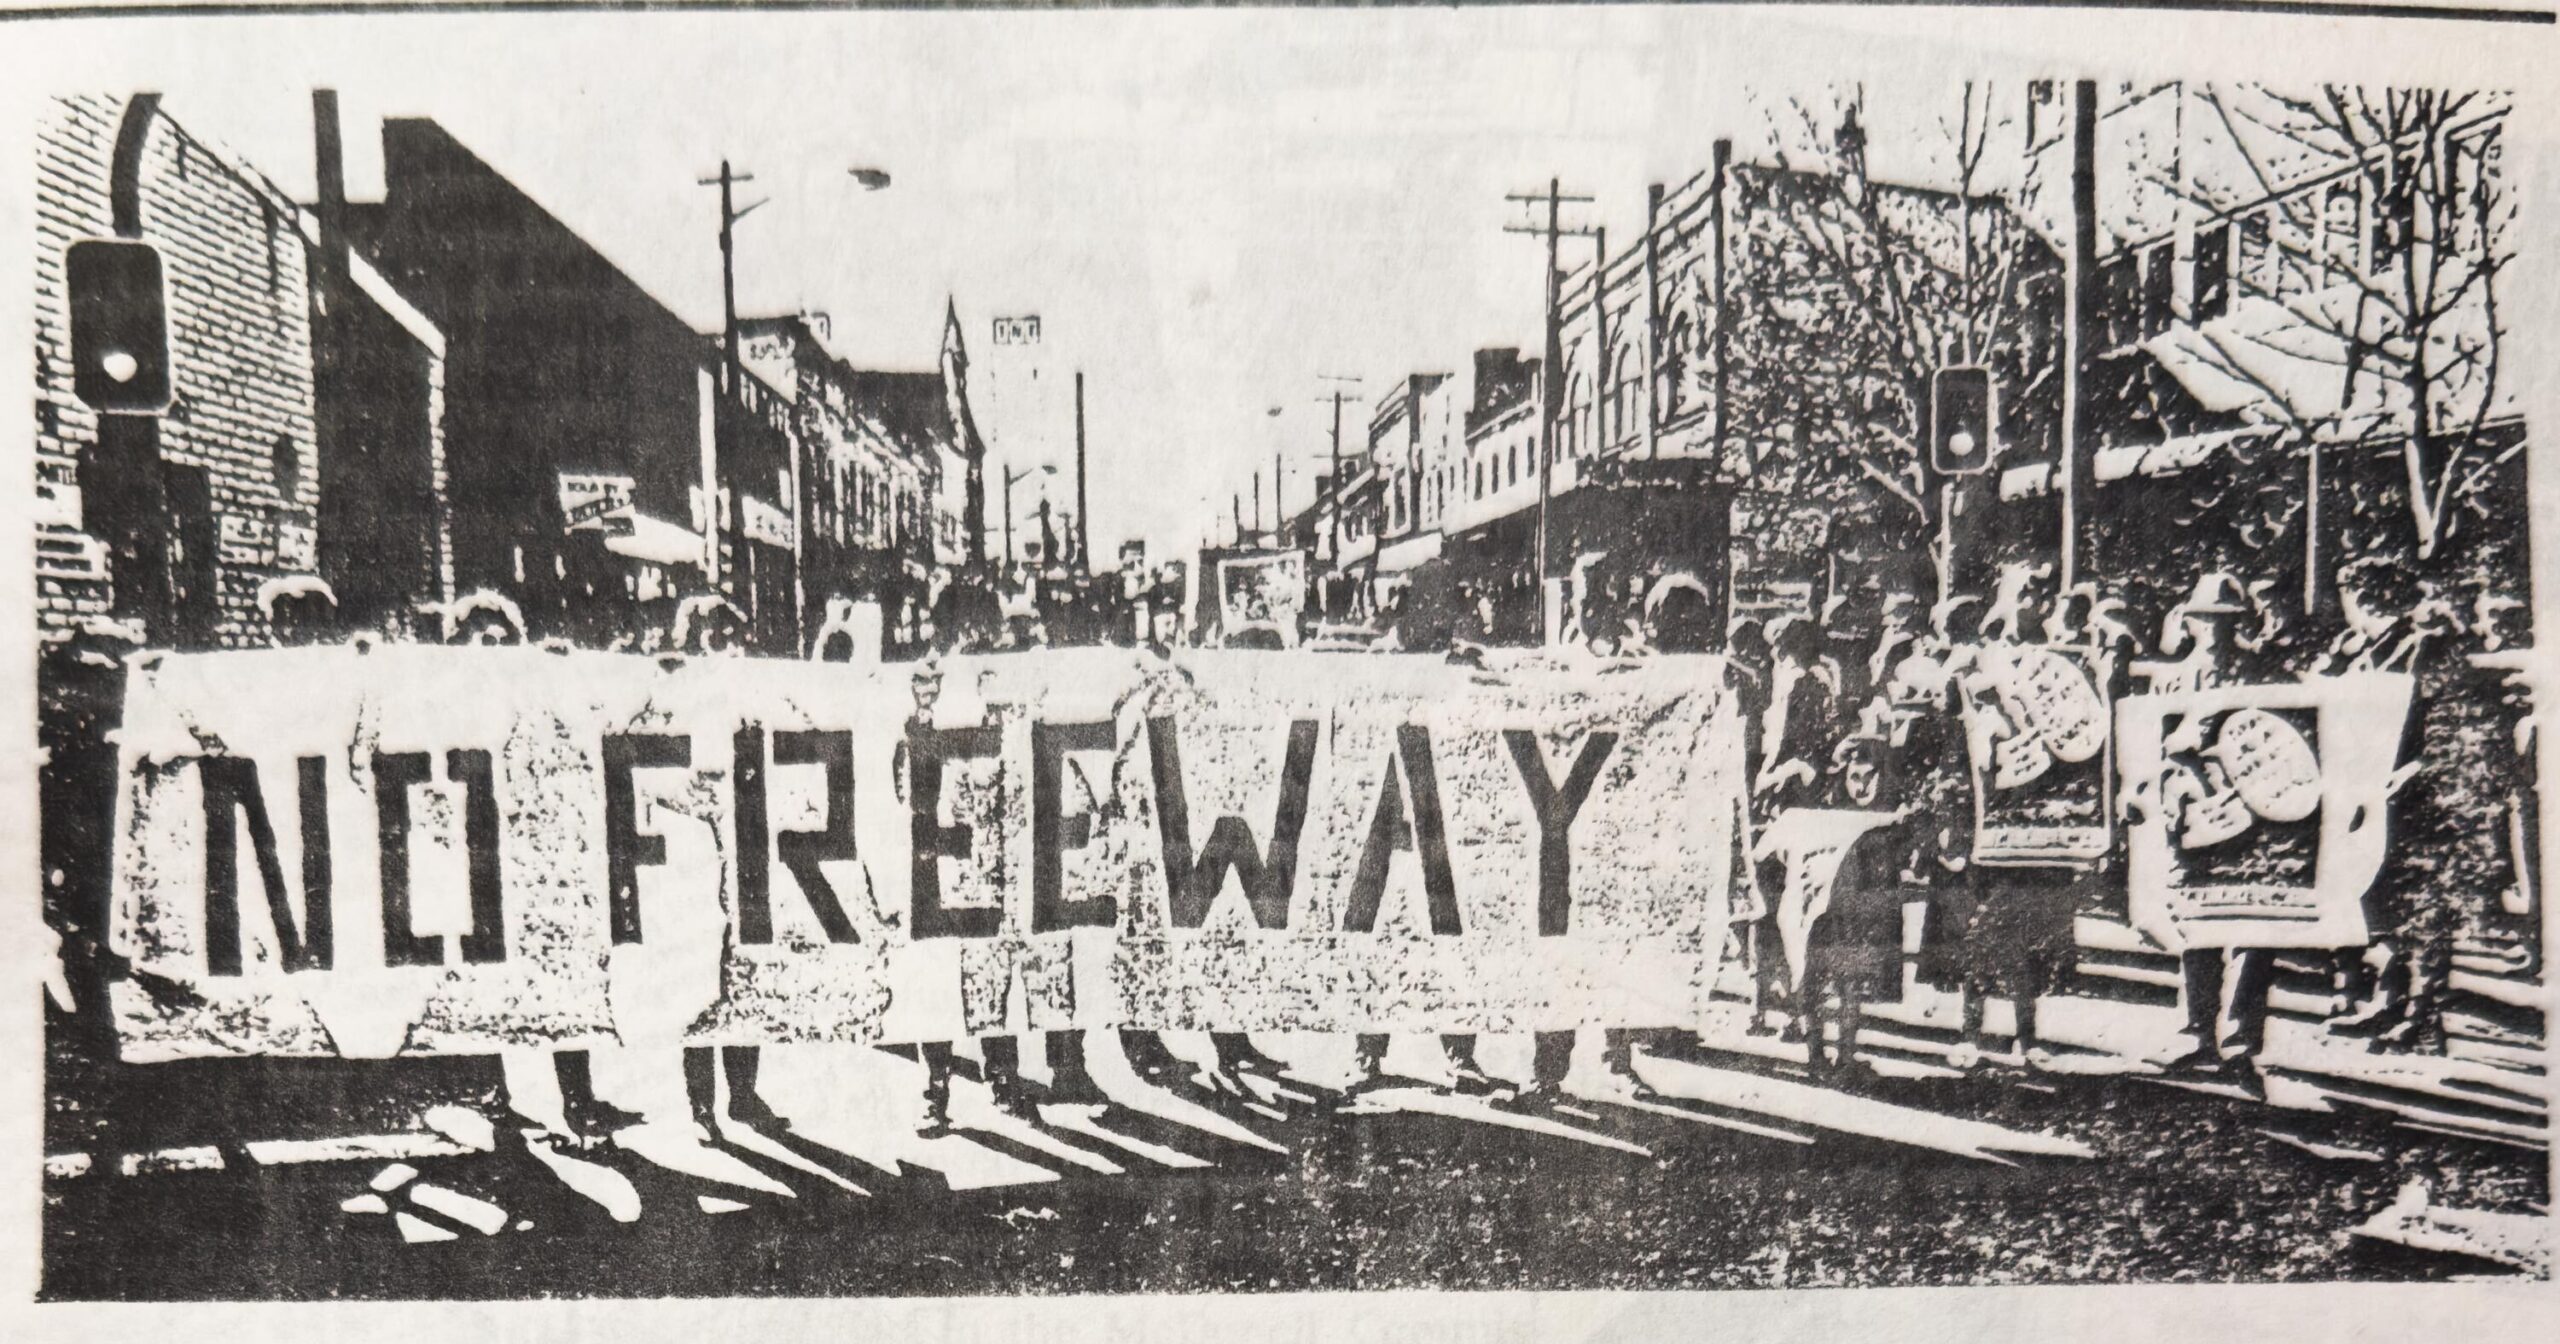
Have you heard of the Southern Arterial Route in Sydney? I hadn’t either – but you won’t be able to unsee the scar through Ultimo, Chippendale, Redfern and Waterloo. Here’s a ~12,000-word Wikipedia article with 153 references – with page numbers, for every sentence – to bring you and your search engine up to speed.
-
Why Won’t the Media Report Accurately on Road Deaths?
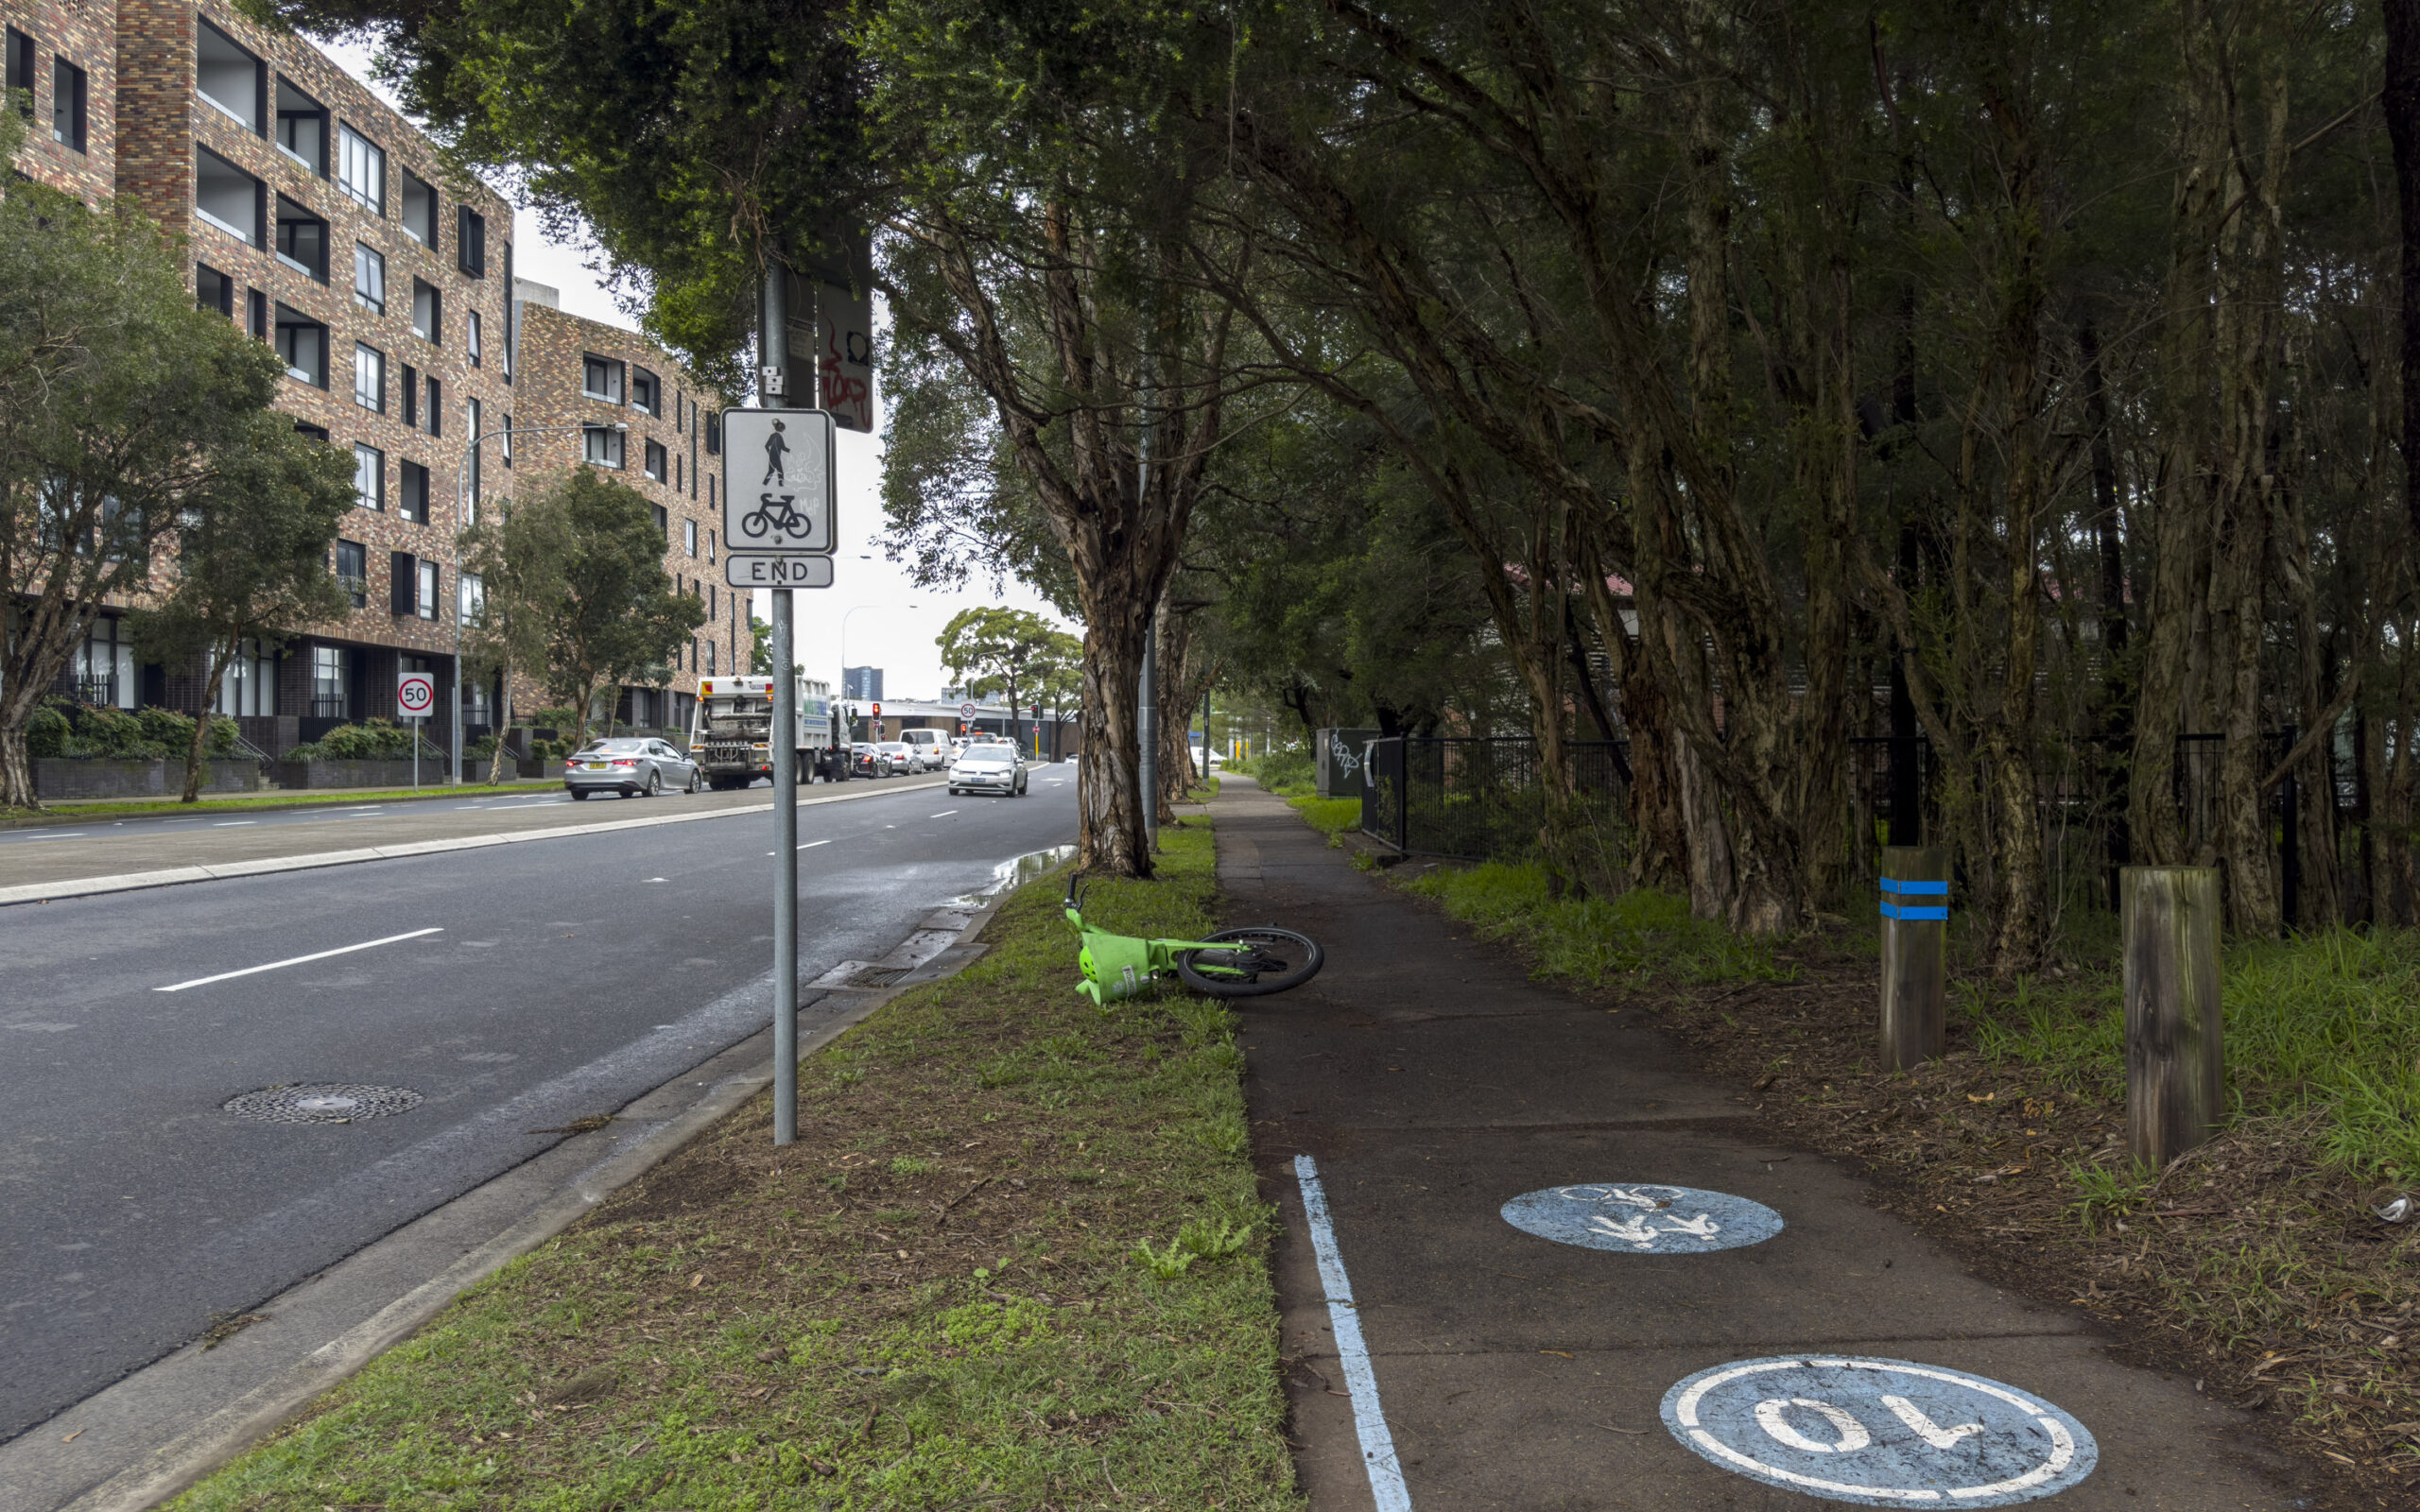
Yesterday, a man in his 30s riding a Lime e-bike, motor-limited to 25km/h, was struck by a 28-year-old man driving a garbage truck at Little Regent Street and Broadway, Ultimo – and died at the scene. This is a legal e-bike, and the man was just a few hundred metres from Sydney’s Central Station.
-
List of pedestrian, cyclist and personal mobility device road deaths in NSW in 2025
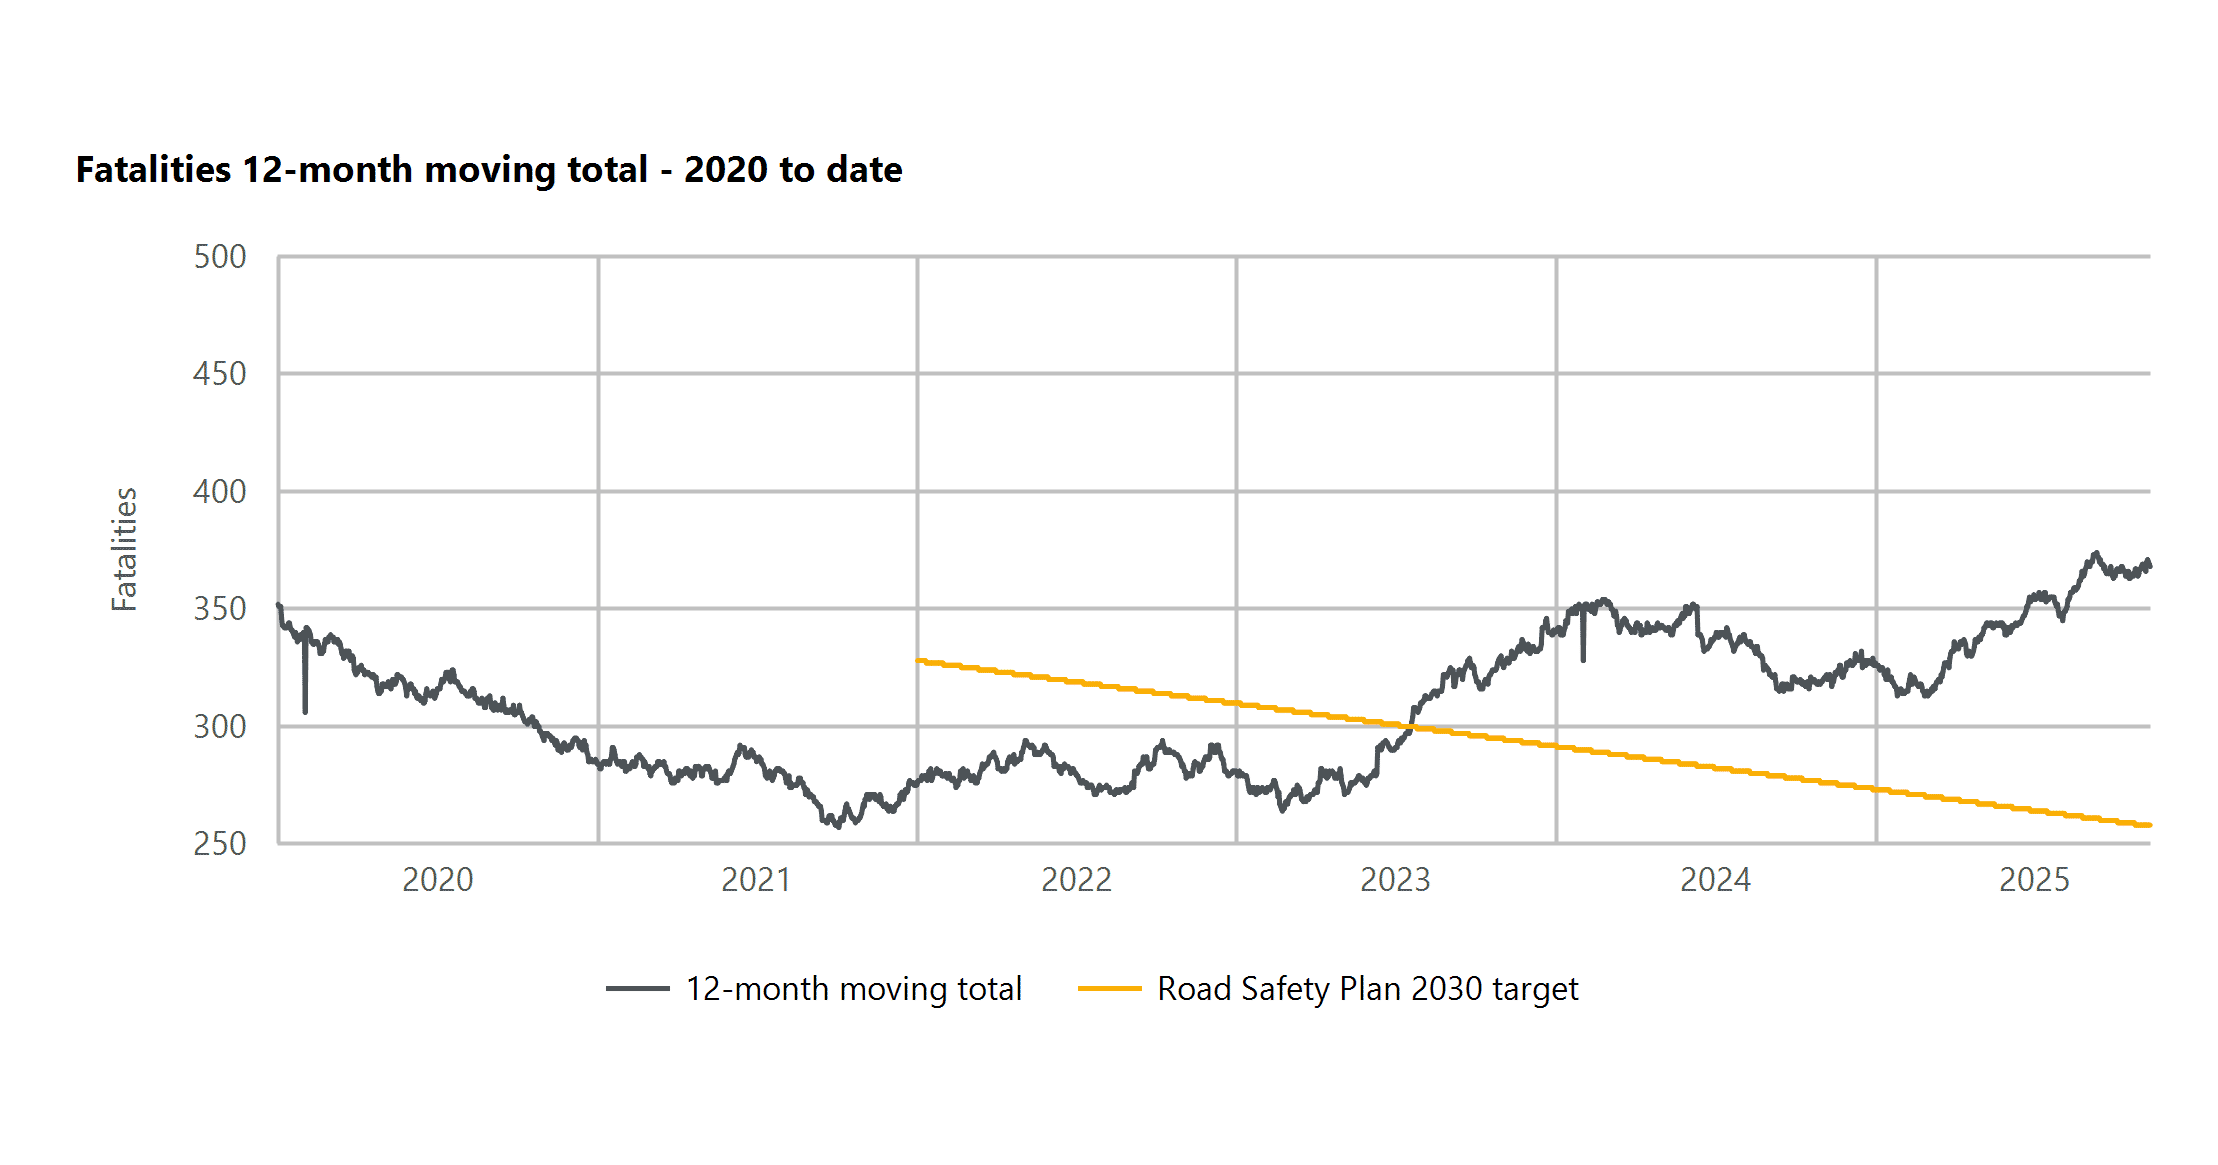
This page is a list of pedestrian, cyclist and personal mobility device road deaths across New South Wales (Australia) in 2025, sourced from NSW Police press releases and daily government statistics. It is not guaranteed to be complete or up to date; BITRE monthly bulletins should be referenced for complete statistics (though preliminary and subject…
-
Green Lights More Often: The Secret 2018 Study of Sydney’s Traffic Signals
On the 7th of January 2018, Transport for NSW (TfNSW) pulled off something extraordinary – and I personally paid $441 to obtain the previously secret reports documenting it. With such impressive results, why doesn’t TfNSW do it again?
-
Introducing the Heart Foundation’s Community Walkability Map
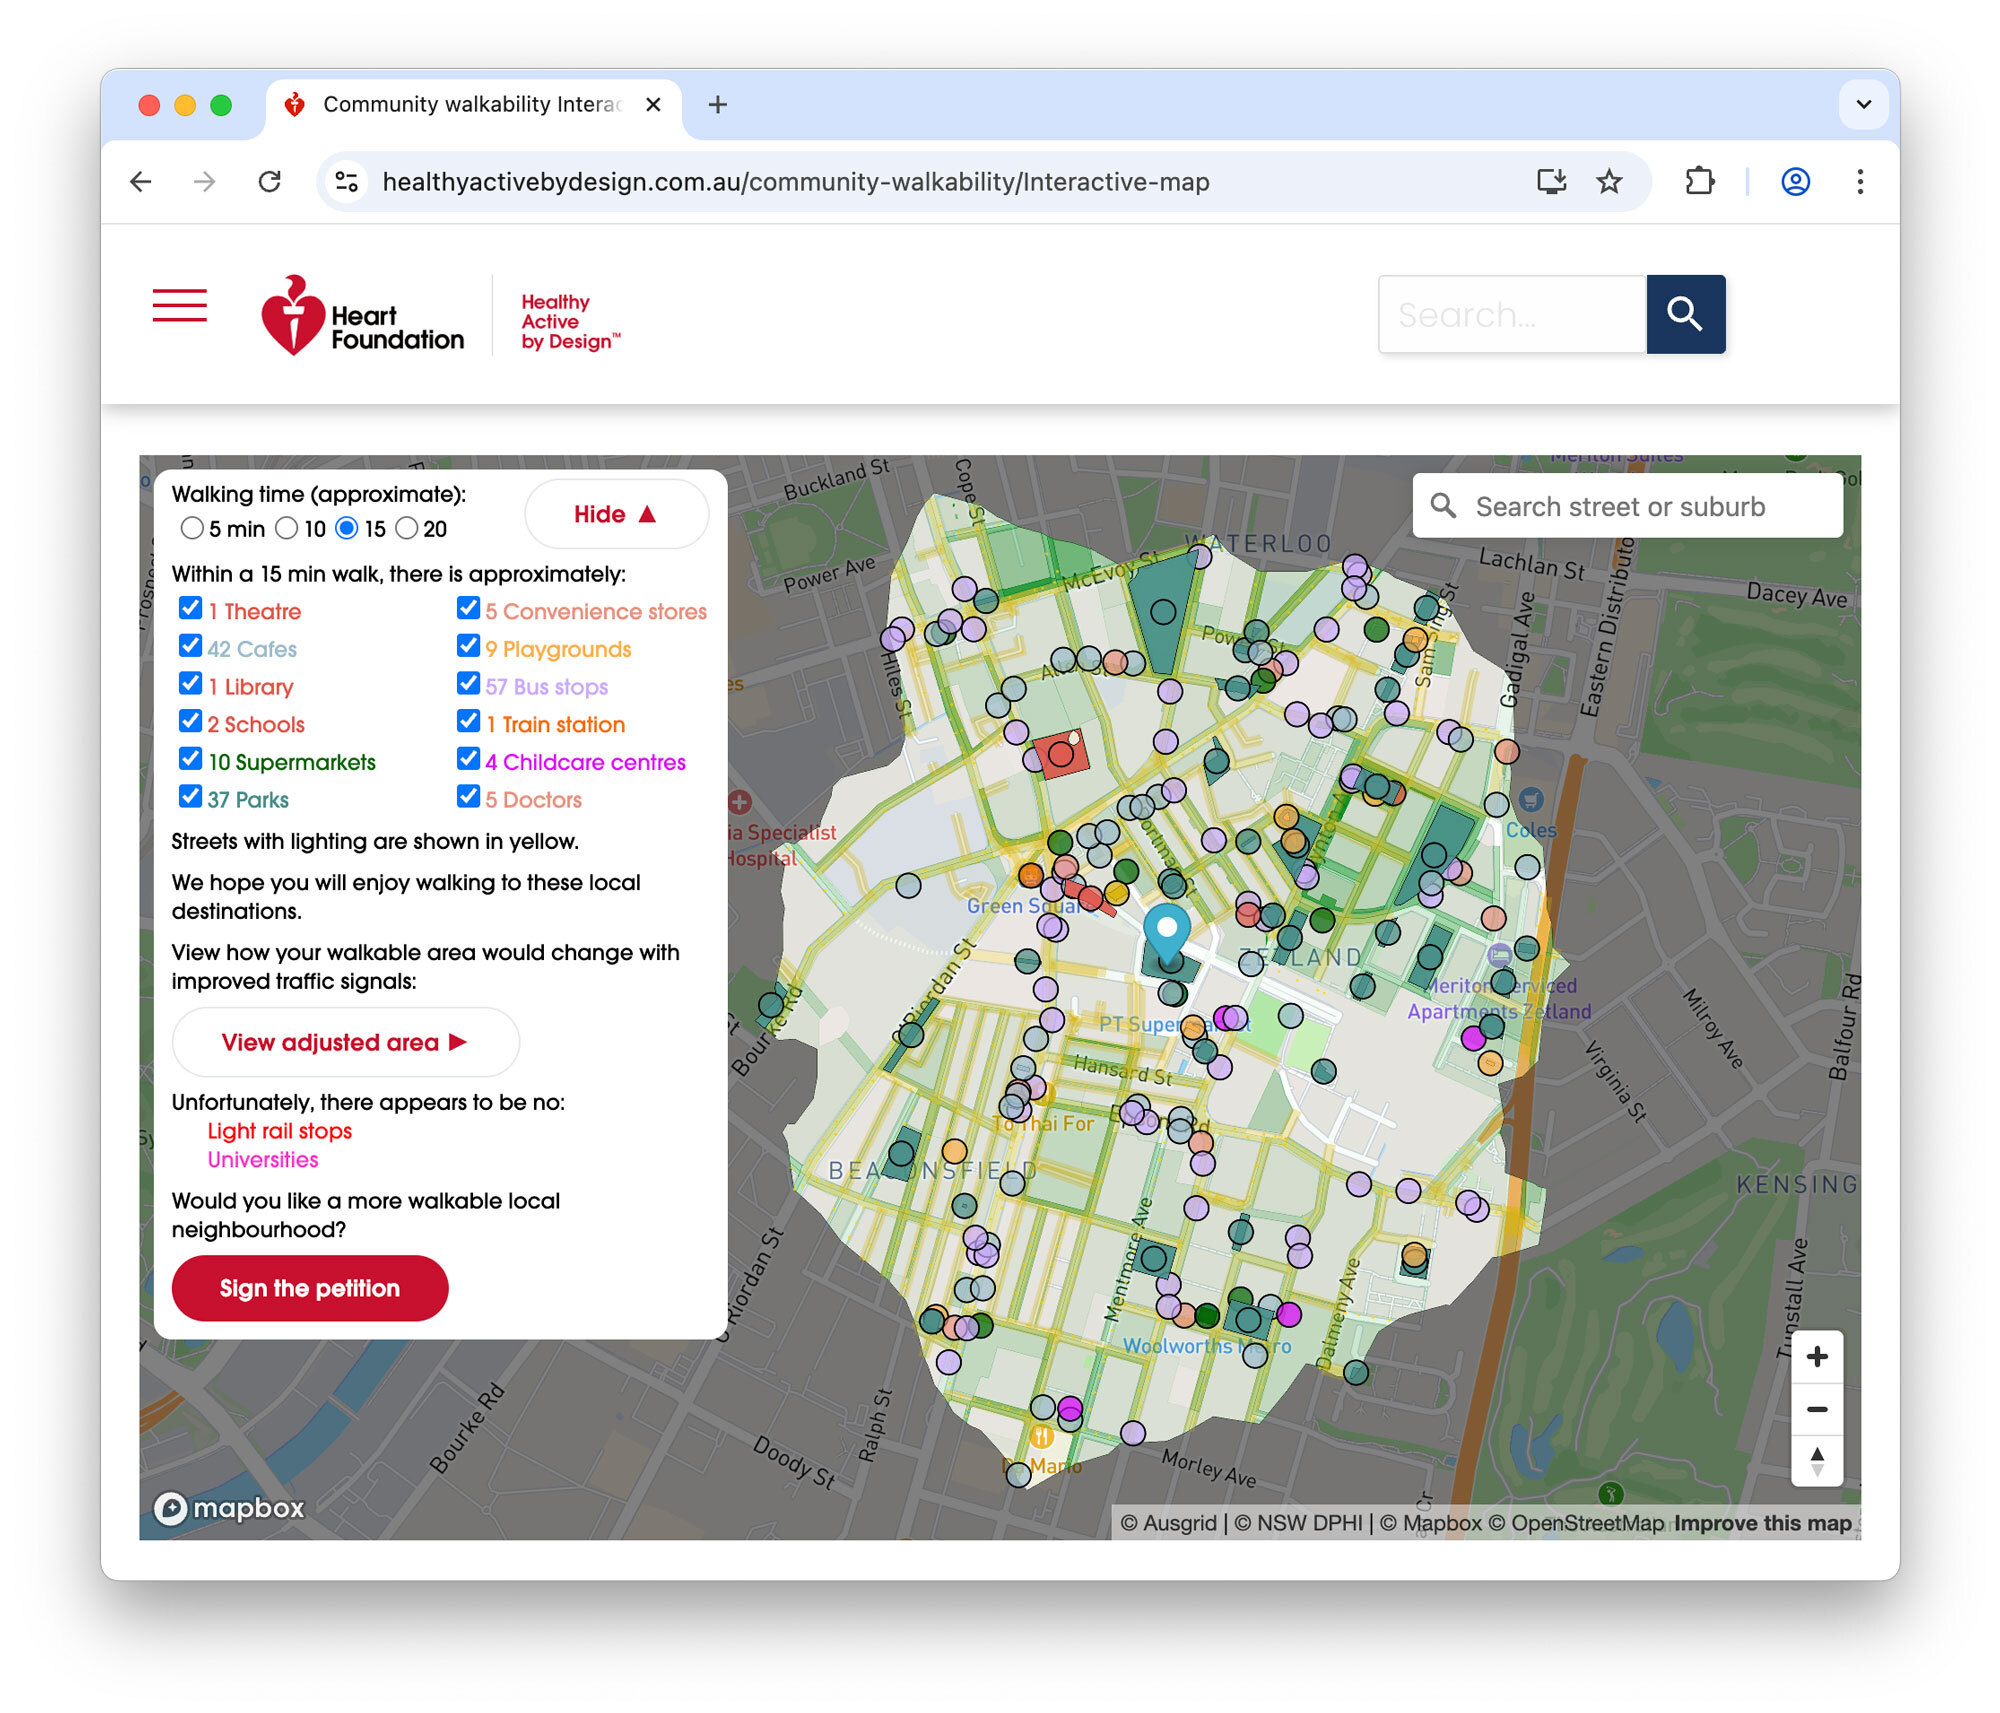
I’m pleased to share the completion of a recent commercial engagement with the Heart Foundation: the Community Walkability Map, a new interactive tool designed to help communities understand and advocate for more walkable, healthier neighbourhoods.
-
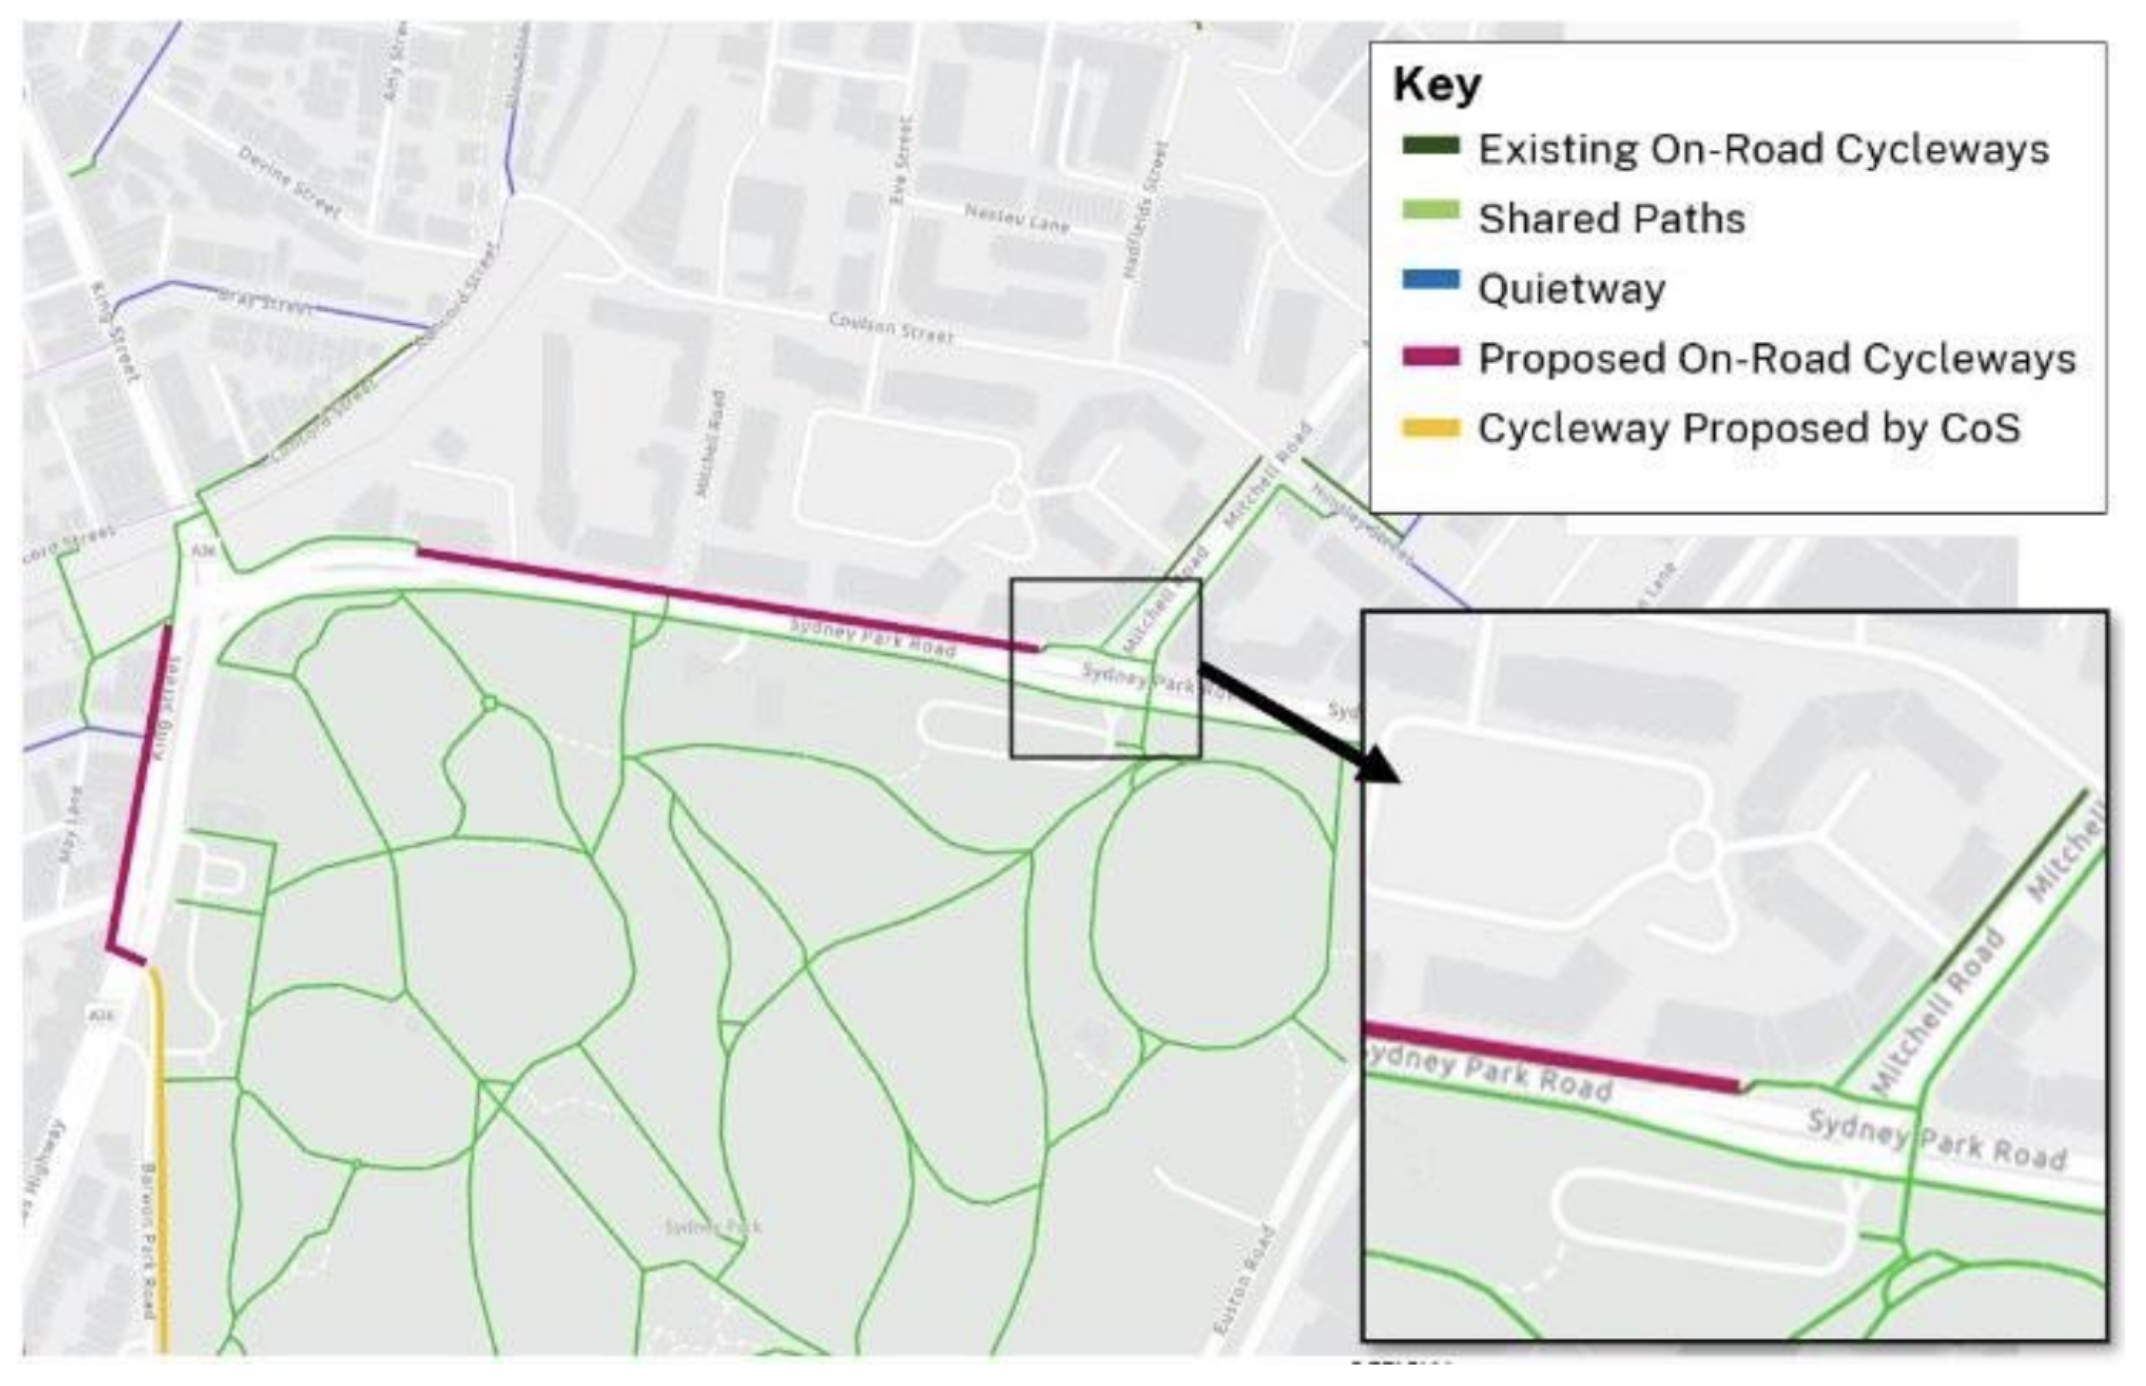
Not enough funding for Sydney Park Junction – Addendum REF to cut scope
On the 20th of November 2024, Jenny Leong (the Green’s MP for Newtown) asked the State Minister for Transport 21 detailed questions in NSW Parliament regarding the status and fate of the infamous TfNSW Sydney Park Junction project. The public received a response from the Minister for Transport on the 20th of December 2024, which only included answers…
-
No Signal for Pedestrian Safety: TfNSW Refuses Signal Data During National Road Safety Week
This week is National Road Safety Week. Traffic injury is the biggest killer of Australian children under 15 and the second-biggest killer of all Australians aged between 15 and 24. 50 people walking are killed on NSW roads and streets every year and this figure is trending up. Many of these people are killed waiting…
-
Sydney Park Junction: TfNSW Won’t Commit to Original Scope Despite Ministerial Intervention
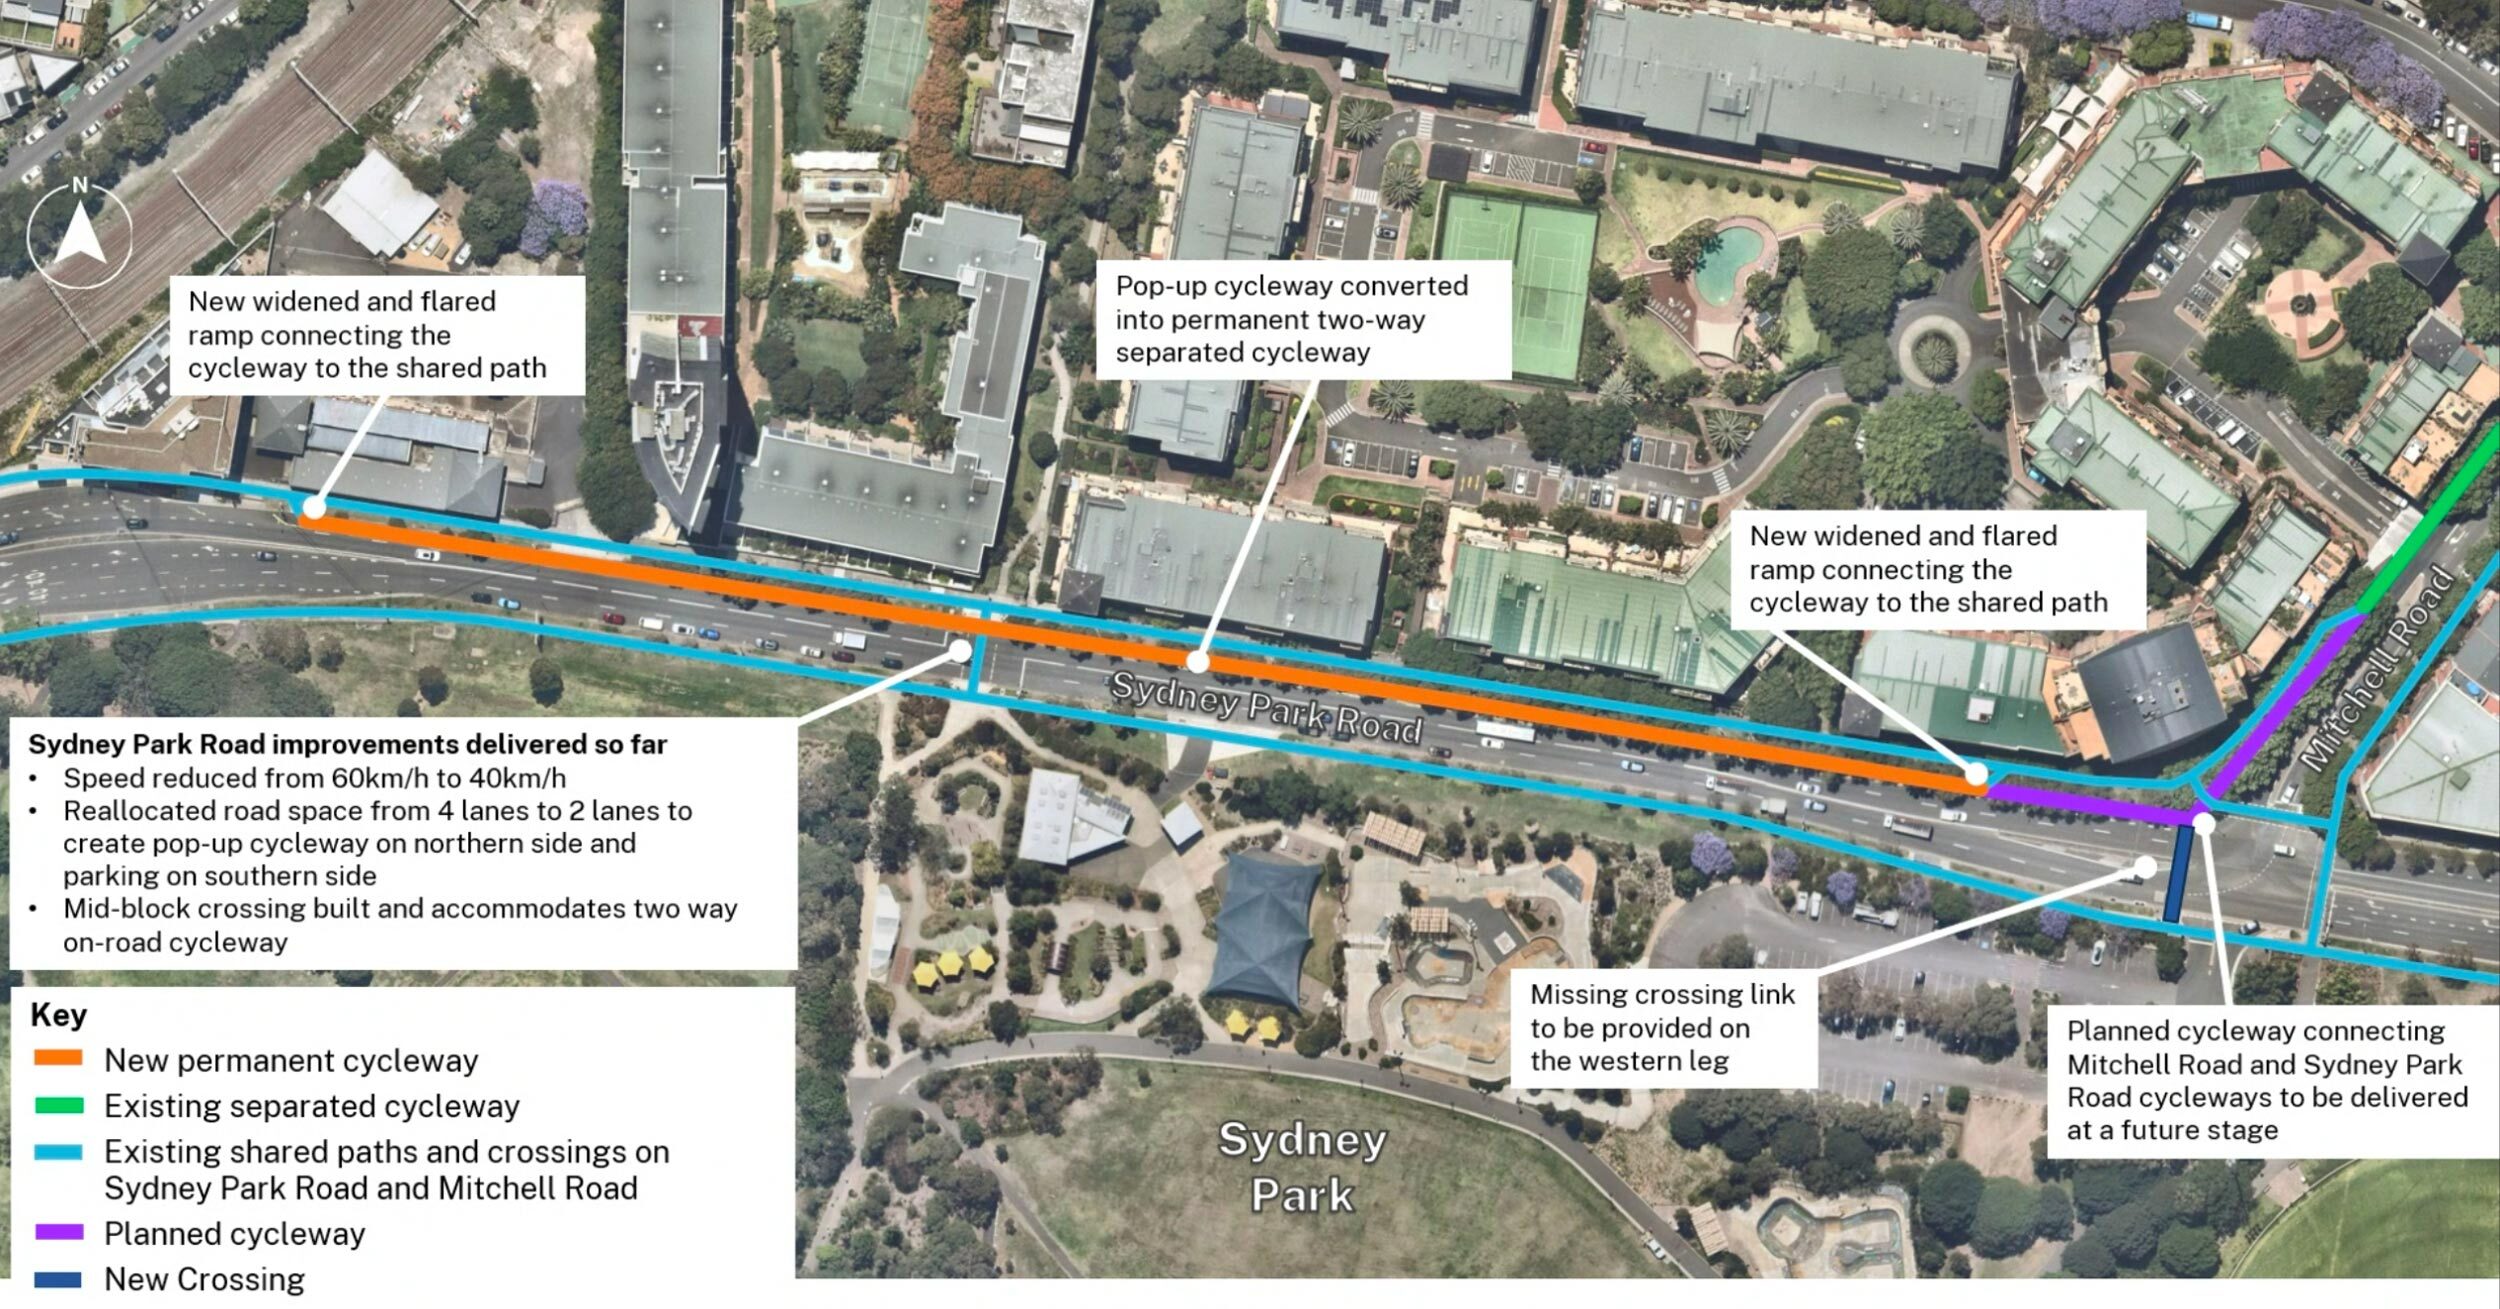
TfNSW won’t confirm the Sydney Park Junction project scope even though “Haylen’s office confirmed the upgrades would take place as the initial proposal publicly exhibited in 2021”.
-
Better Streets submission to the Epping Bridge Project
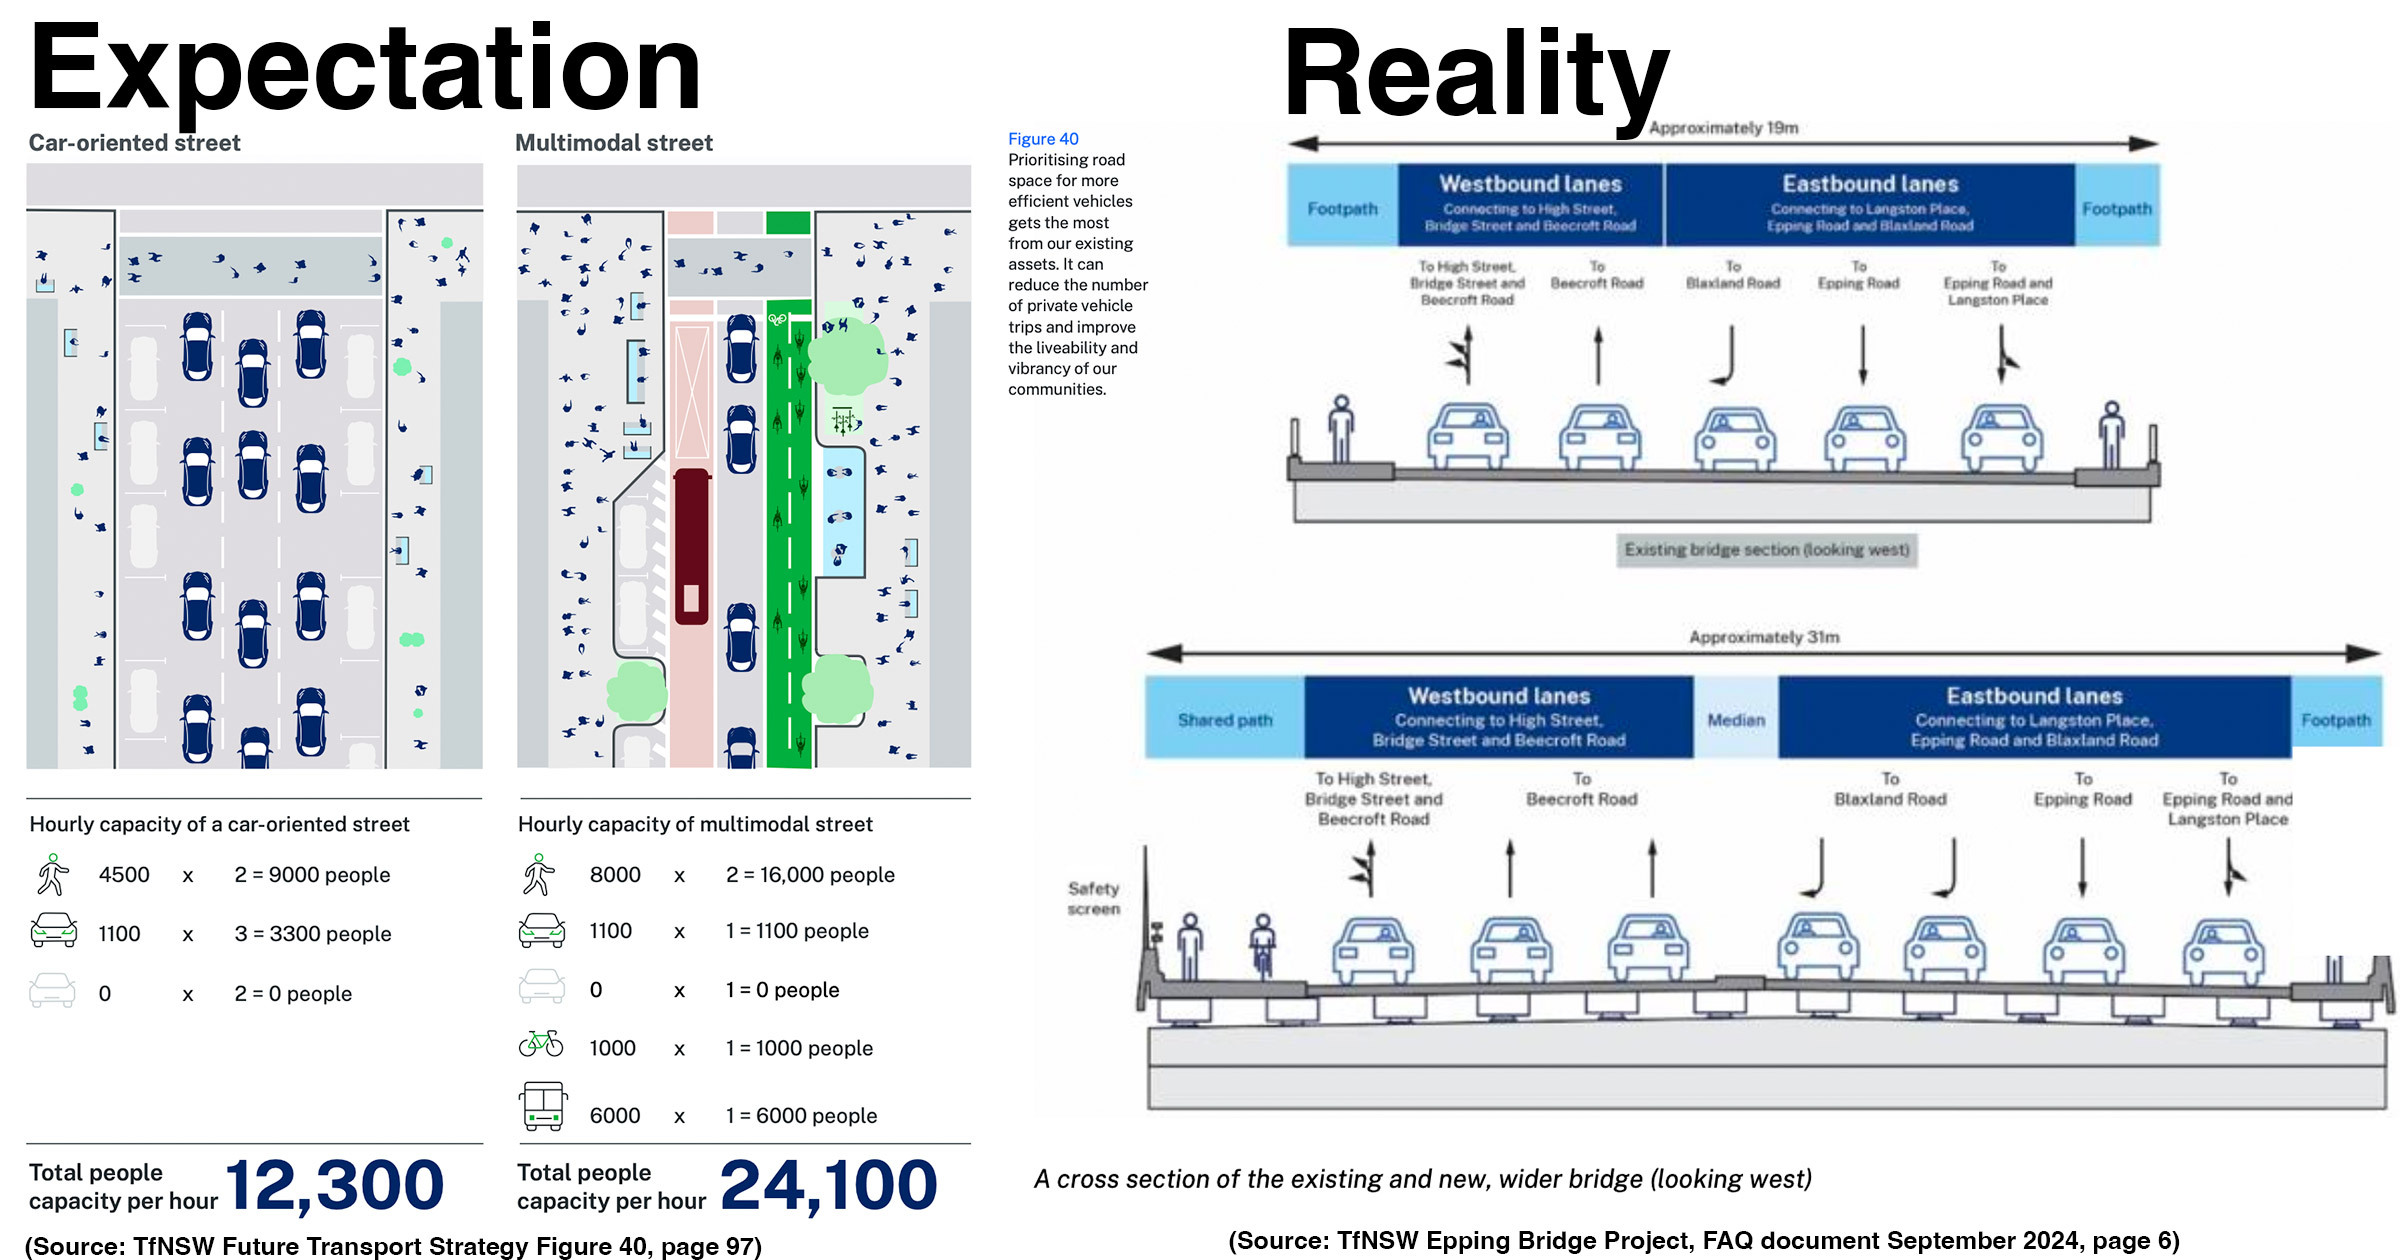
The Epping Bridge Project is first and foremost a road widening project (5 car lanes to 7 car lanes). It does not follow Transport for NSW’s own Road User and Space Allocation Policy or Movement & Place design framework, and at $220 million costs double the allocation for active transport for the entire state over…
-
Another broken WestConnex promise: secret Sydney Park Junction design changes
Ever wondered why there are random dead ends for cycle paths in Sydney? This is a deep dive on how one particular missing link might not get fixed after more than seven years of planning. Let this be a record of how hard it is to get safe cycling intersections built in Sydney, even when…
-
Why Did the Chicken Catch the Metro? Because It Was Faster Than Crossing the Road…
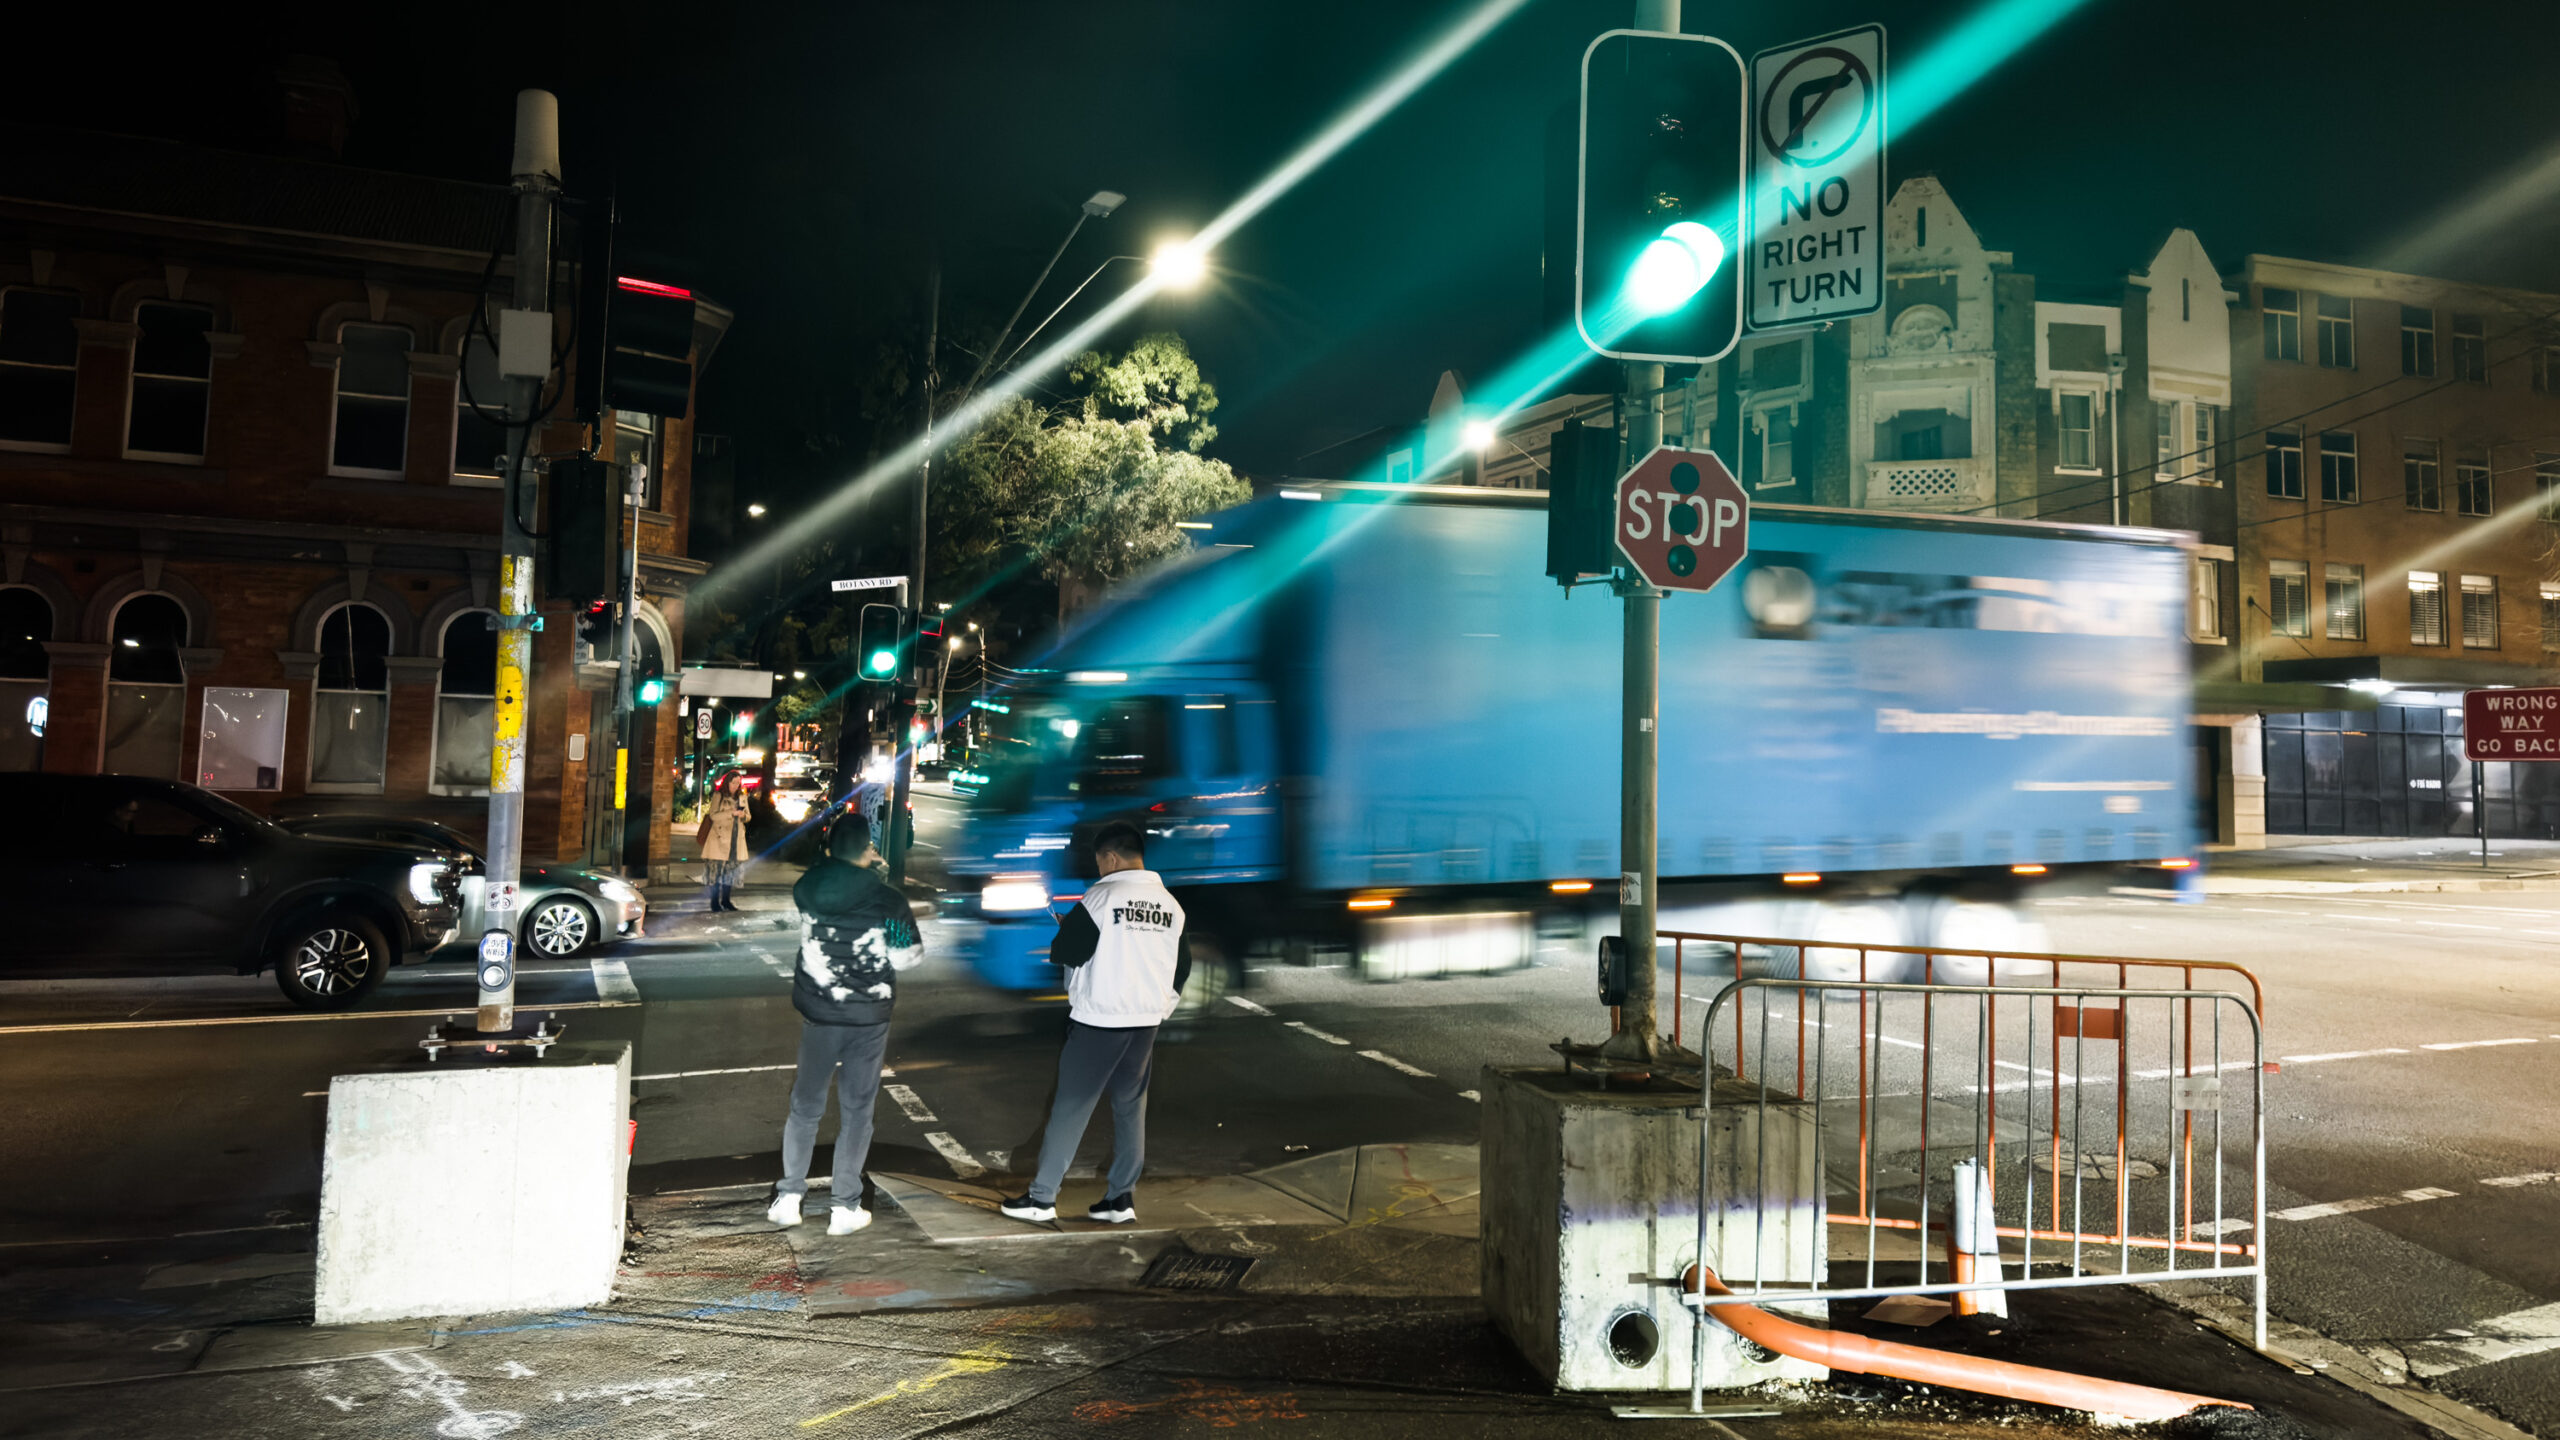
Sydney’s phenomenal new metro takes only ~100 seconds (1m40s) to travel from Central Station to the new Waterloo Station. However, you could be stuck waiting up to ~111 seconds (1m 51s) to cross Botany Rd just outside the Waterloo metro station when you arrive!
-
Jake Coppinger nominated for Young Sydneysider of the Year Award (Committee for Sydney)

I’m incredibly humbled to have been nominated for the Committee for Sydney’s Young Sydneysider of the Year award!
-
Preliminary analysis of Better Intersections data
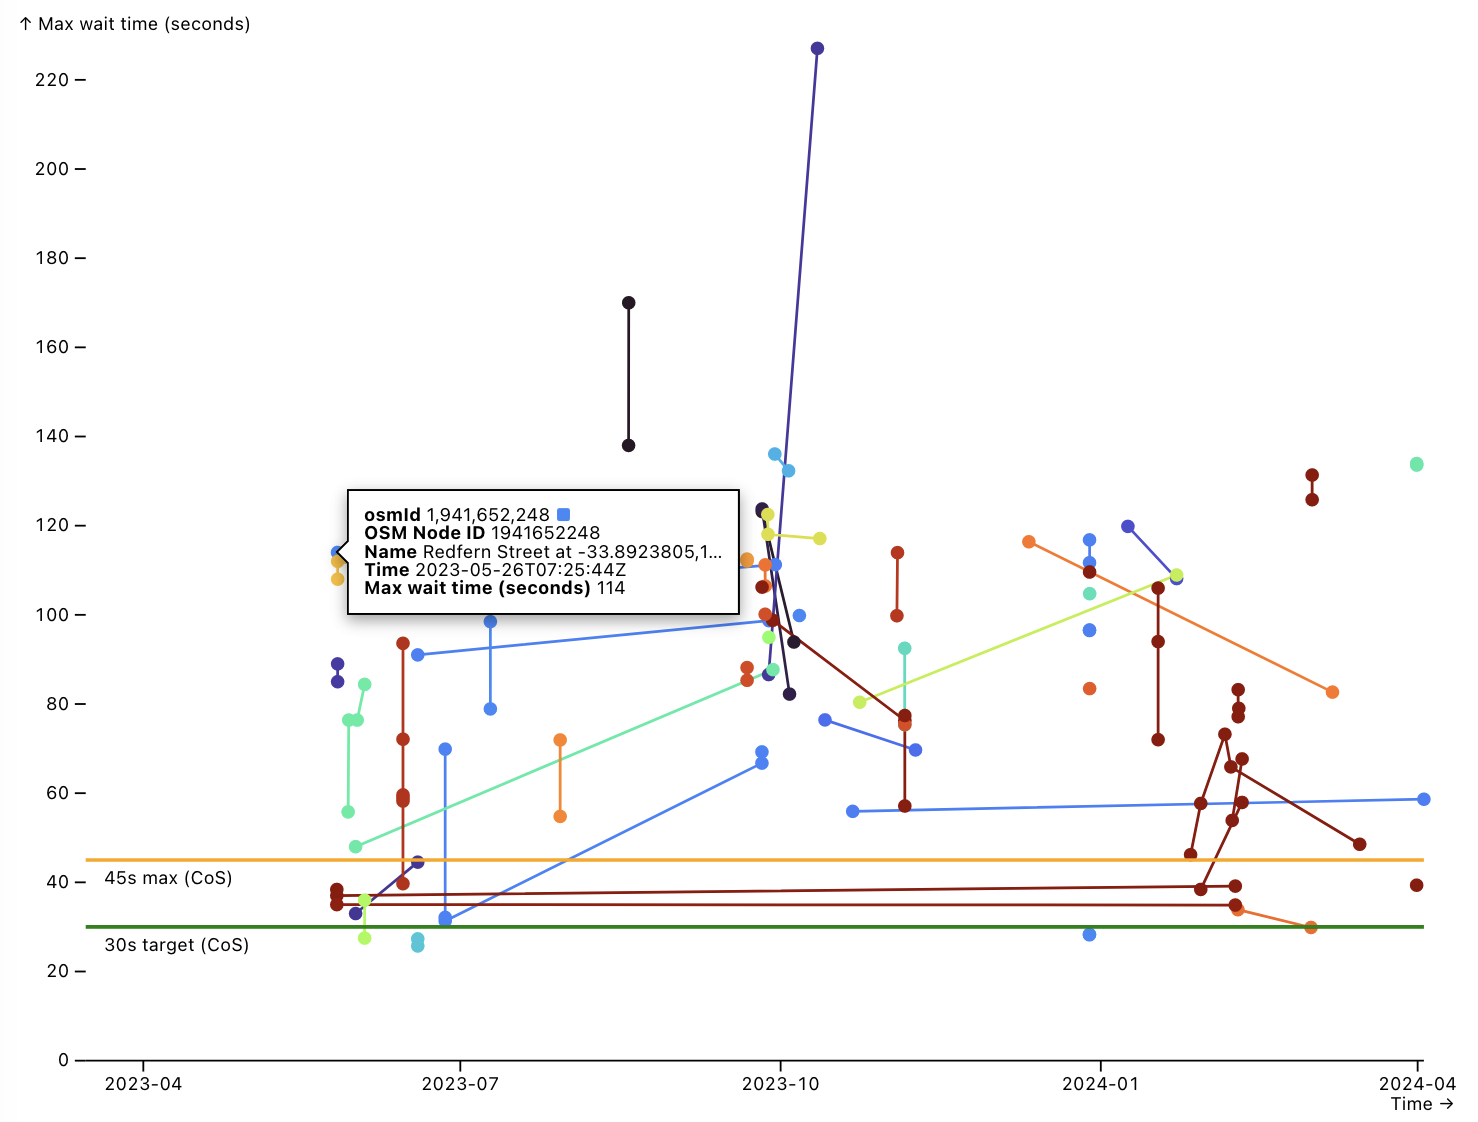
These are a collection of charts picking apart the Better Intersections dataset. They provide multiple avenues to find further patterns in complex and incomplete date, but also as a tool for communicating and demonstrating improvement over time (or perhaps lack thereof).
-
Better Streets submission to the North Bondi Shops and Bus Terminus Upgrade
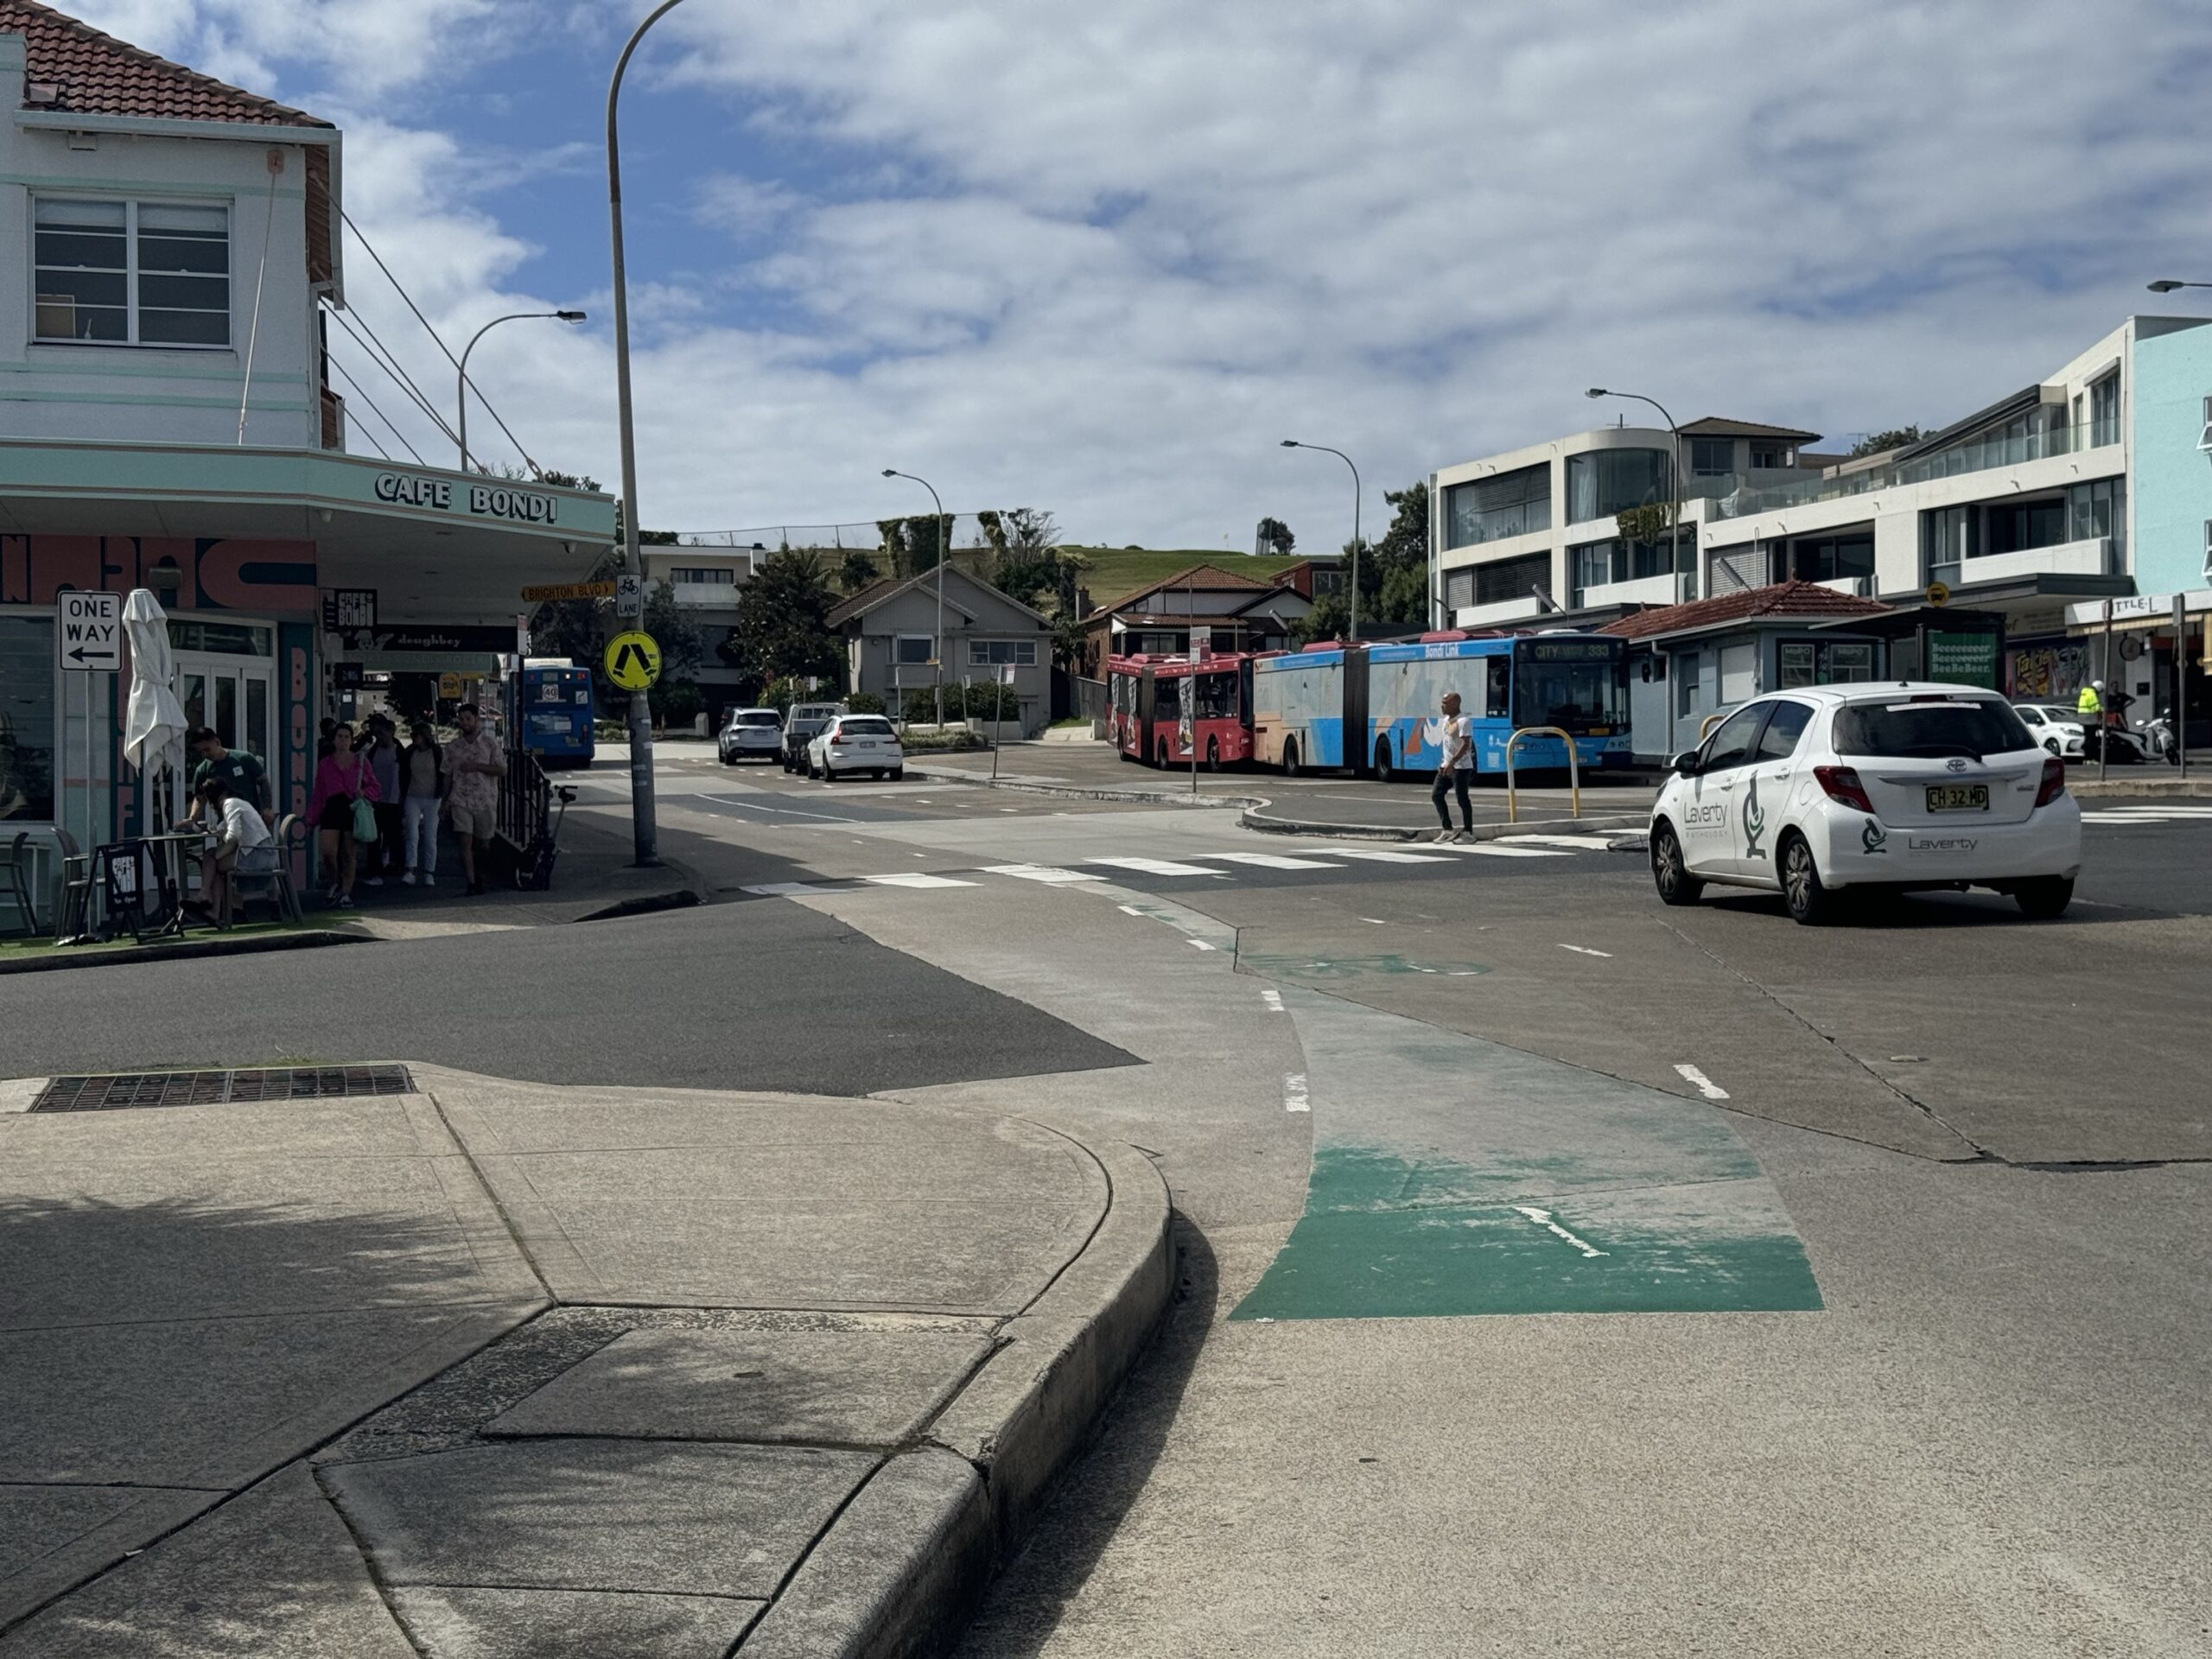
This is a lightly edited version of a submission I wrote on behalf of Better Streets for the public comment opportunity regarding the North Bondi Shops and Bus Terminus Upgrade.
-
Which Australian councils are building the most cycleways?
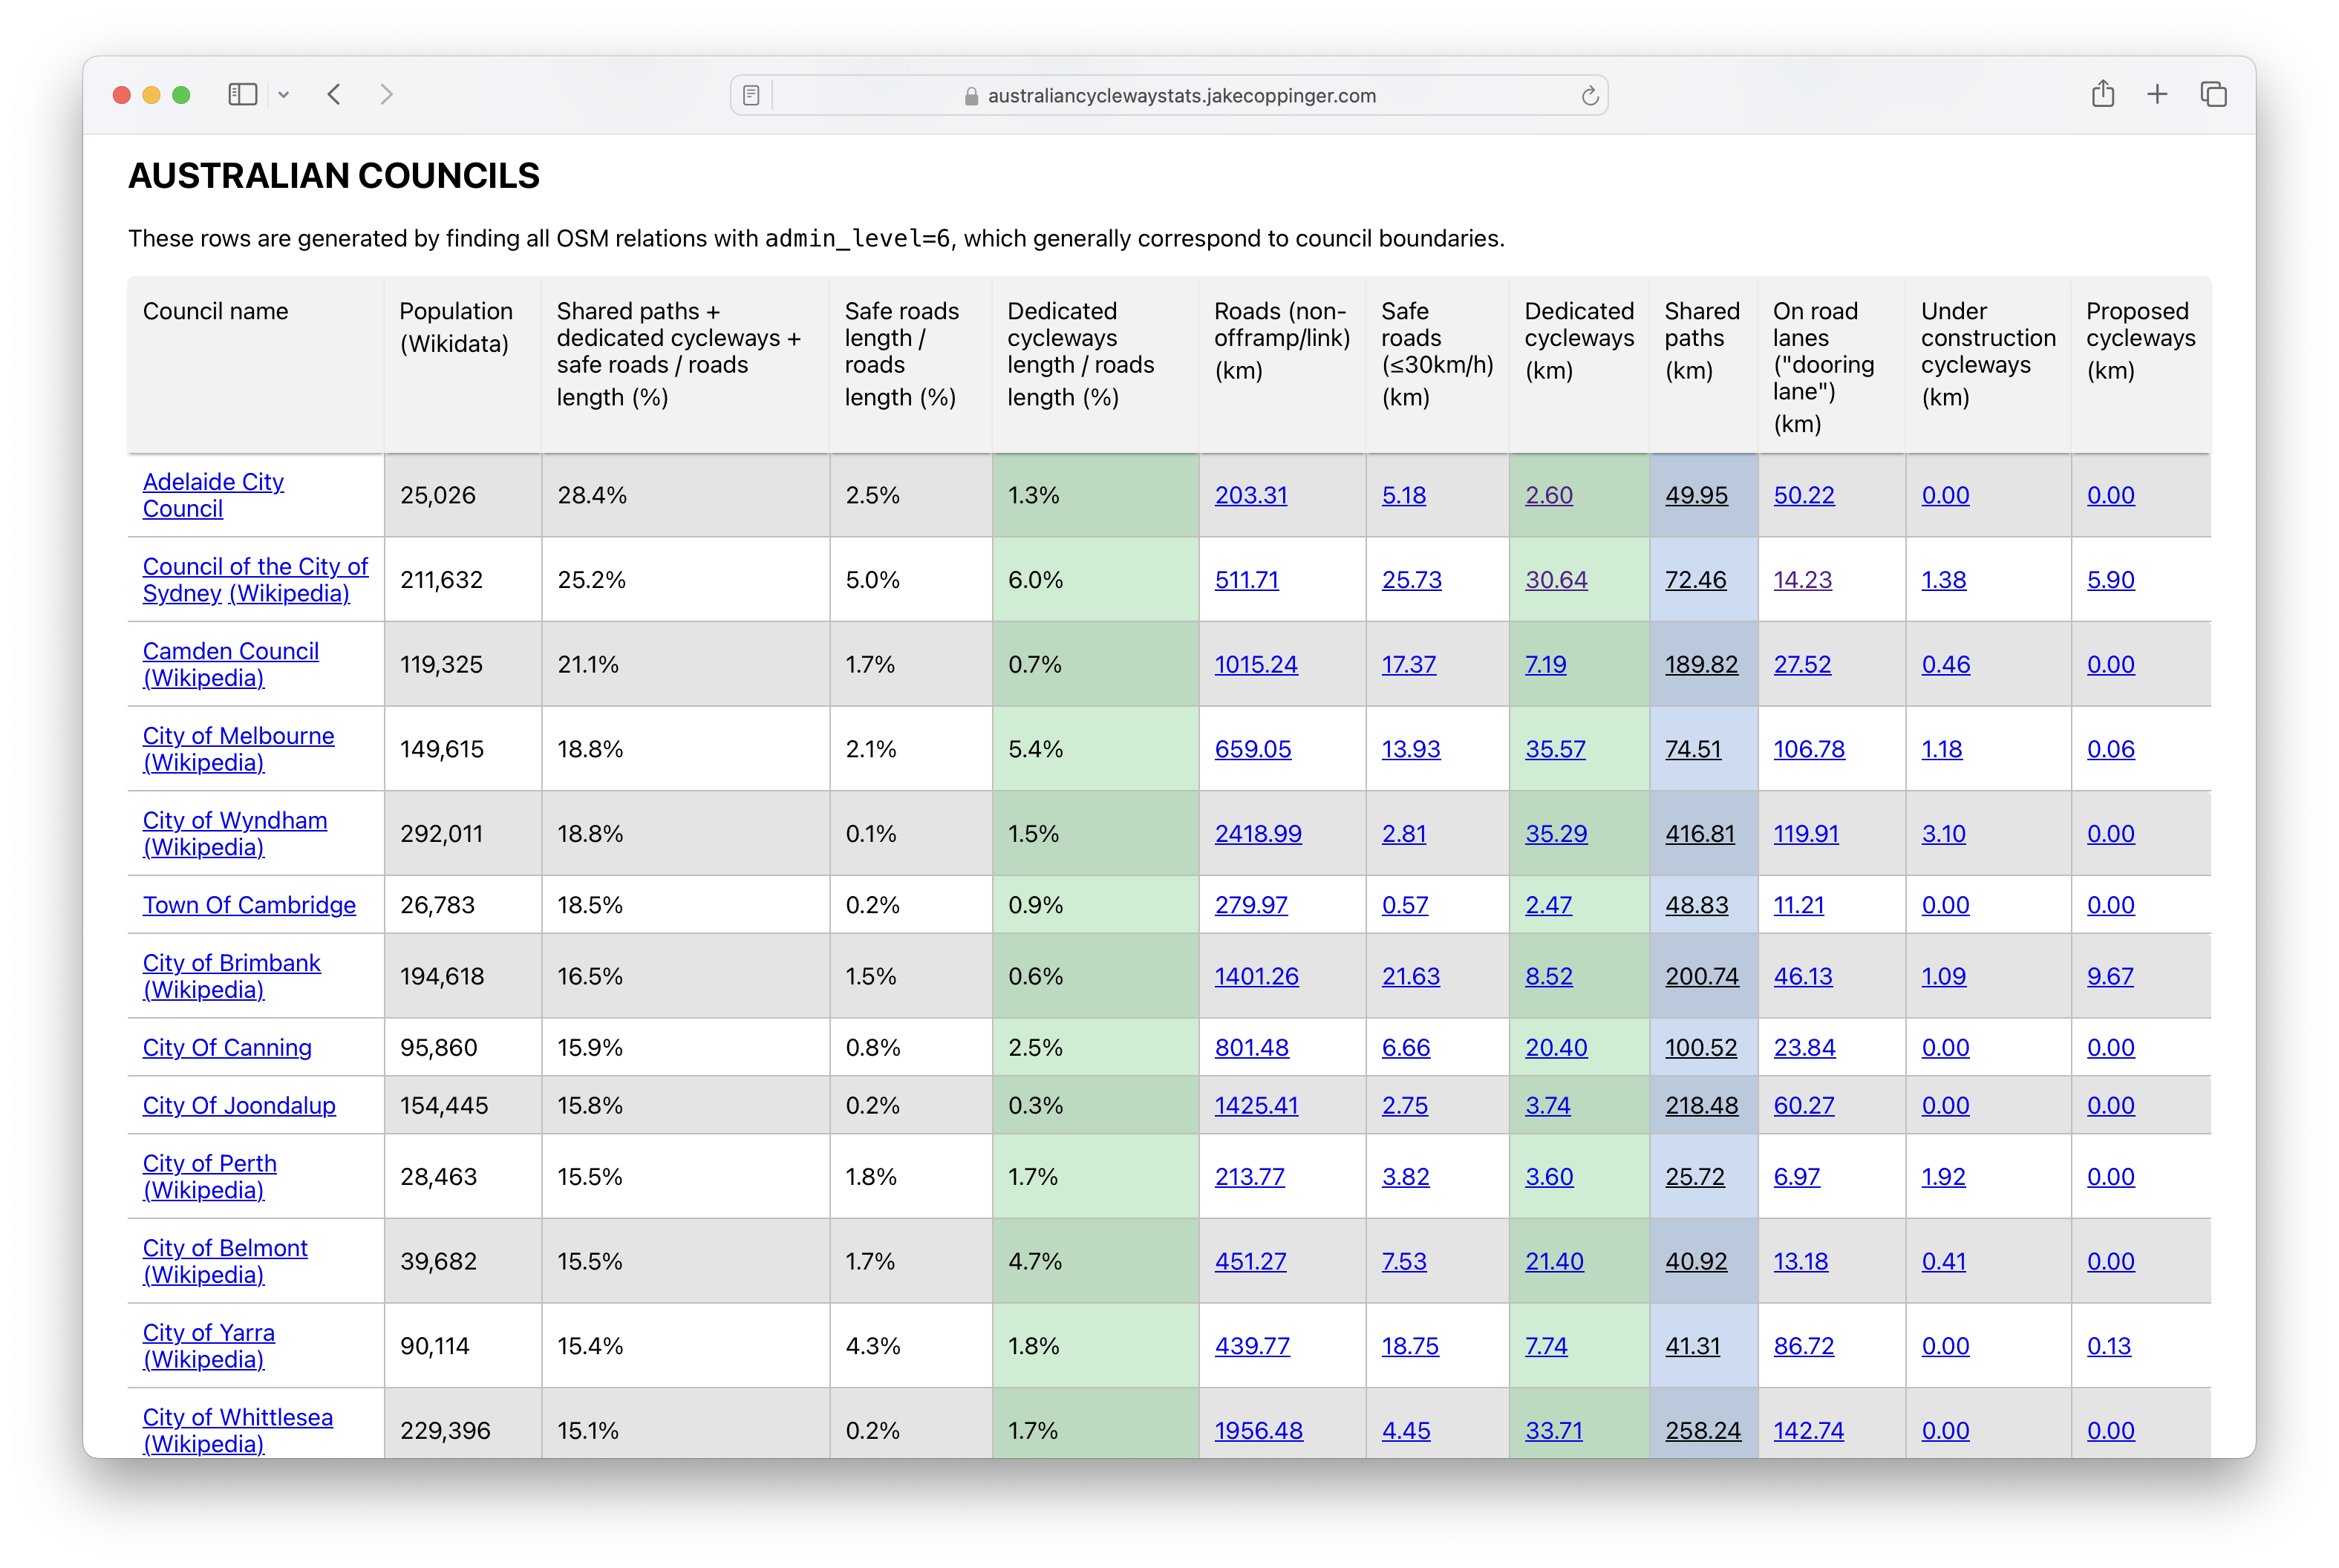
Australian Cycleway Stats is a dashboard that provides an in-depth look at the kilometres of cycleways and safe streets in every Australian council, encompassing current, under-construction, and proposed projects, as well as international benchmarks.
-
Contraflow streets in the City of Sydney
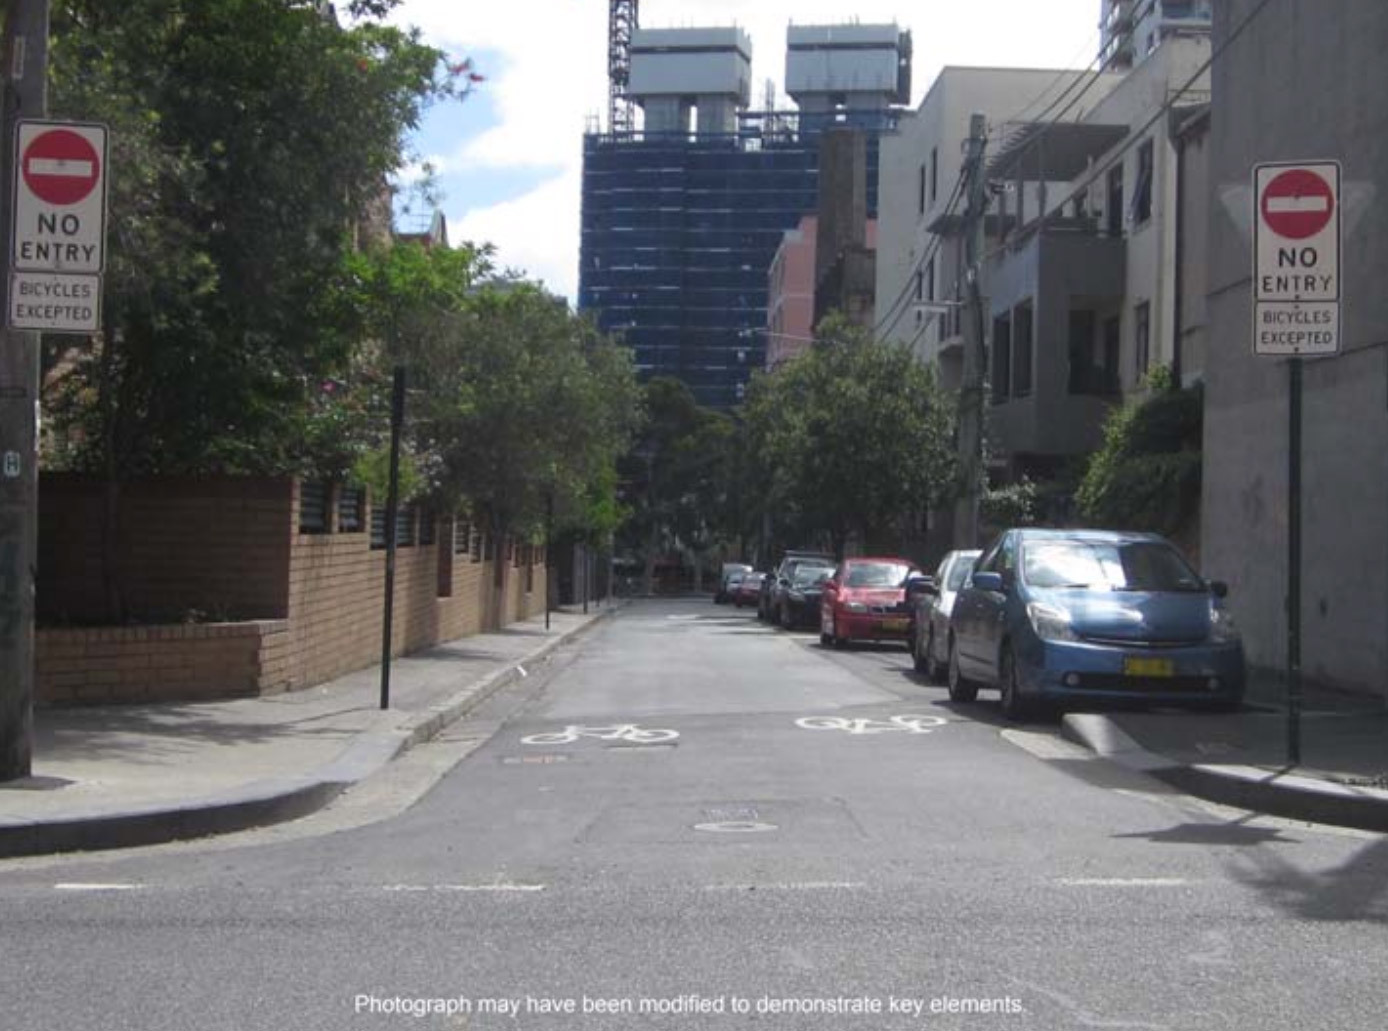
The City of Sydney has recently approved 159 suitable streets across 24 suburbs, which will greatly improve the network of legal cycling routes in inner city Sydney. This blog post is a proposal of additional streets which may be suitable for basic contraflow cycling infrastructure that the council could install in future, with a focus…
-
Shining a Light on the Traffic Signals of Sydney
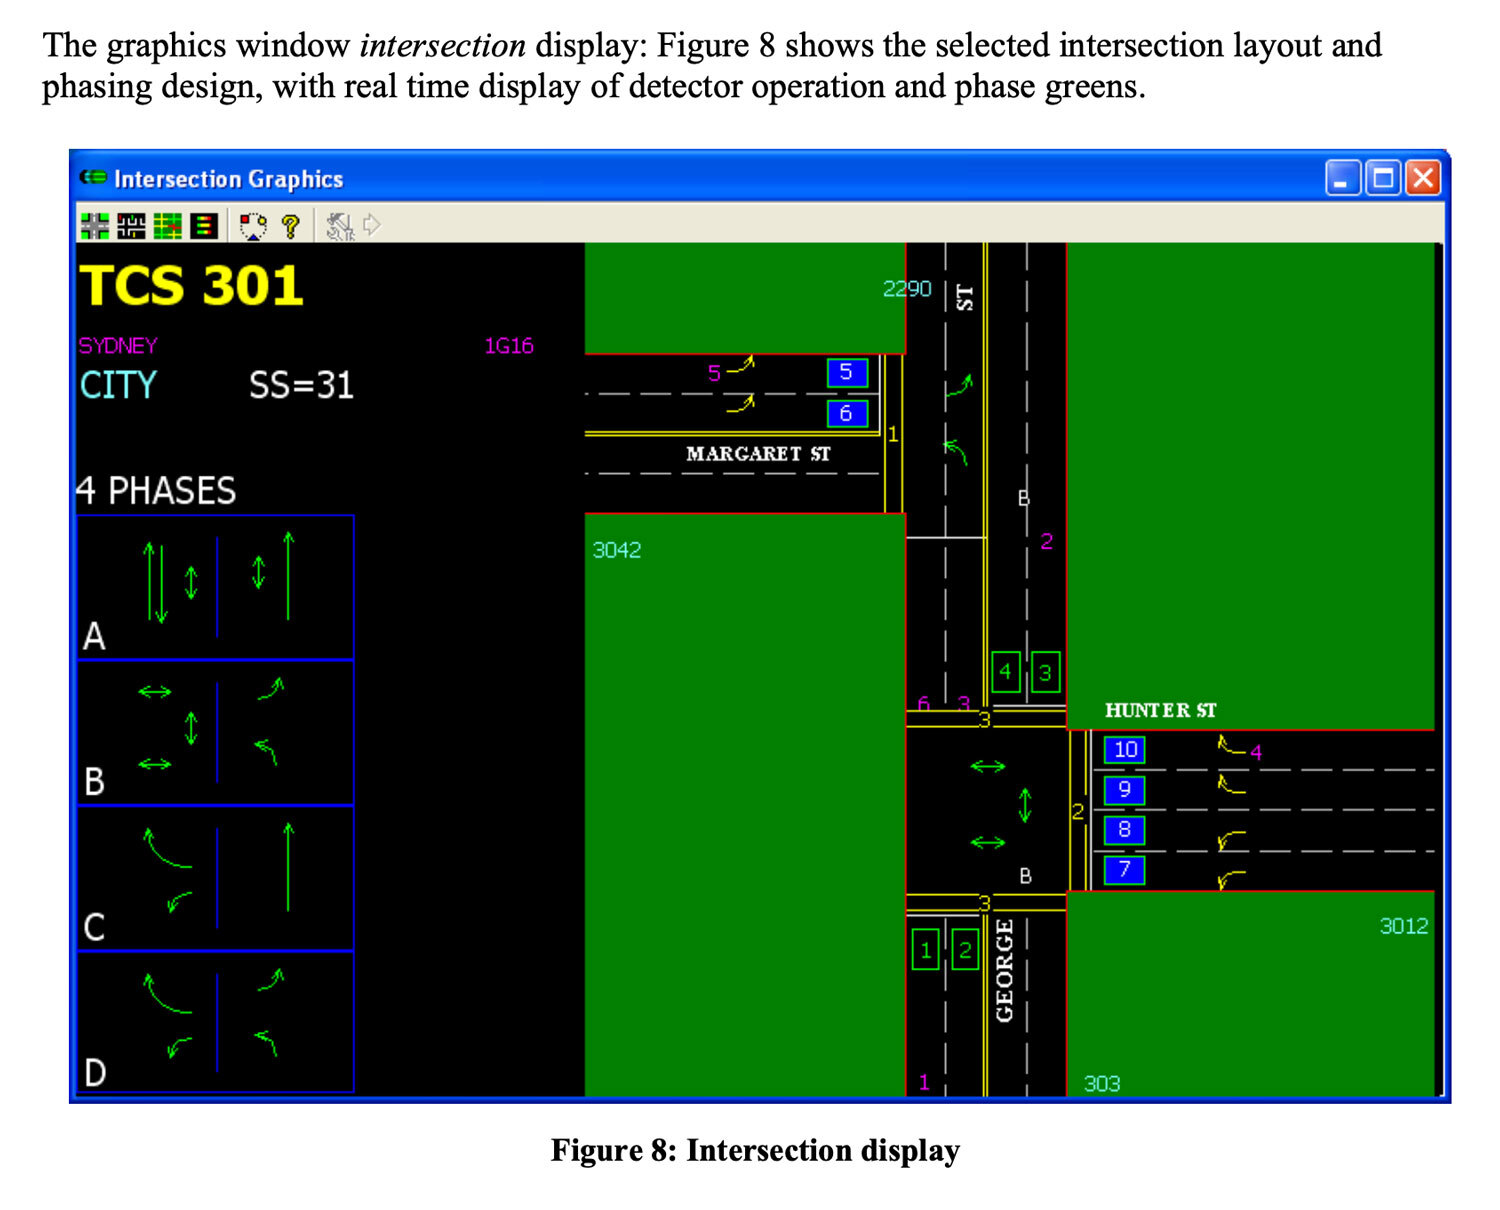
This blog post provides an overview of traffic signal operation in Sydney (focusing on the inner city), based on technical documentation, conversations with government & industry experts and data I’ve collected after building Better Intersections.
-
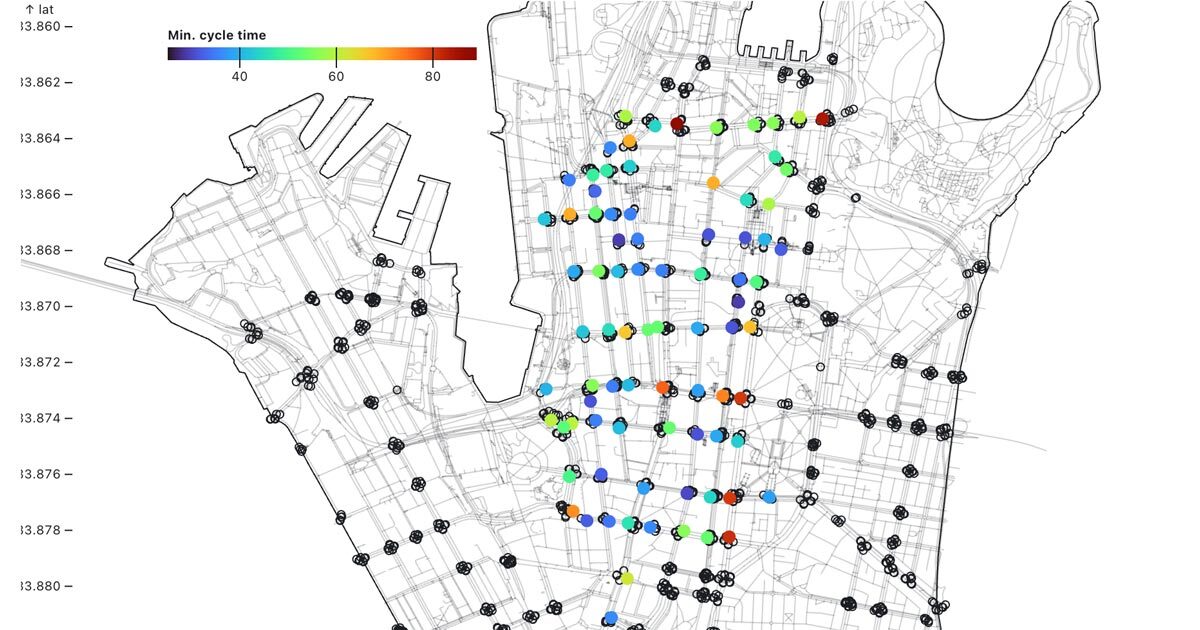
Mapping pedestrian traffic light timing in Sydney, Australia
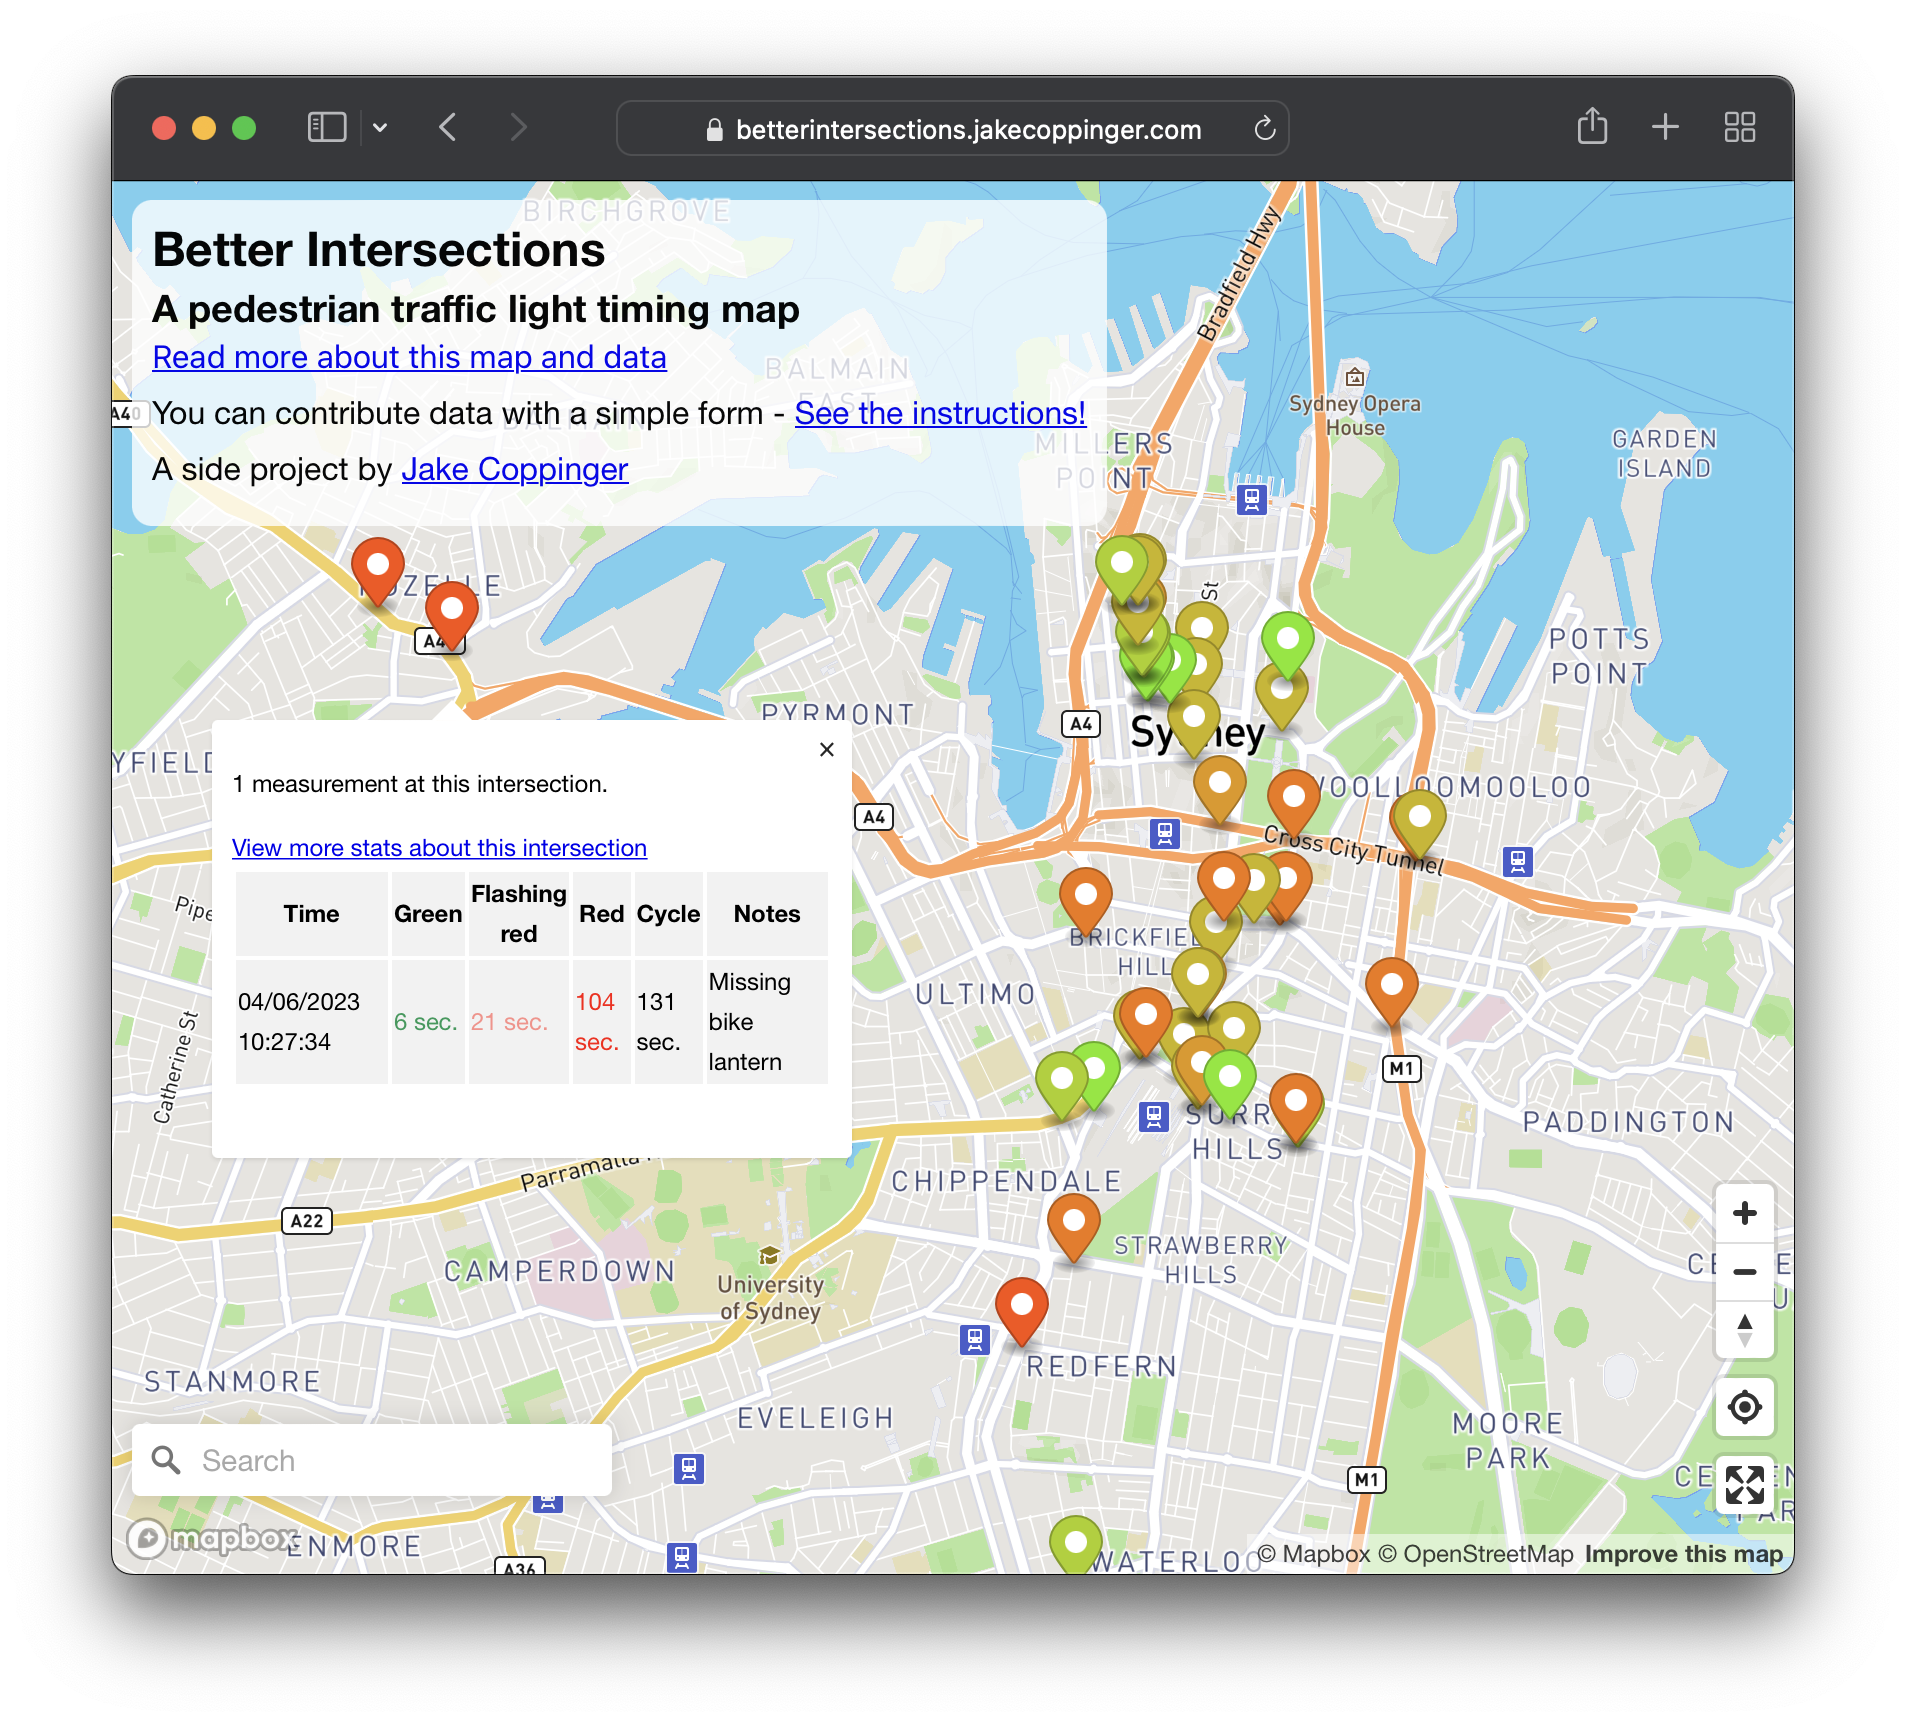
Better Intersections is a tool to record and visualise timing details for pedestrian and bicycle signals. In the absence of traffic light timing data, and as we hold hope for it to become publicly available; the aim of Better Intersections is to crowdsource measurements and inform where positive changes could be made.
-
Subterranean Sydney: A cross-section of Town Hall Station made with iPhone LiDAR
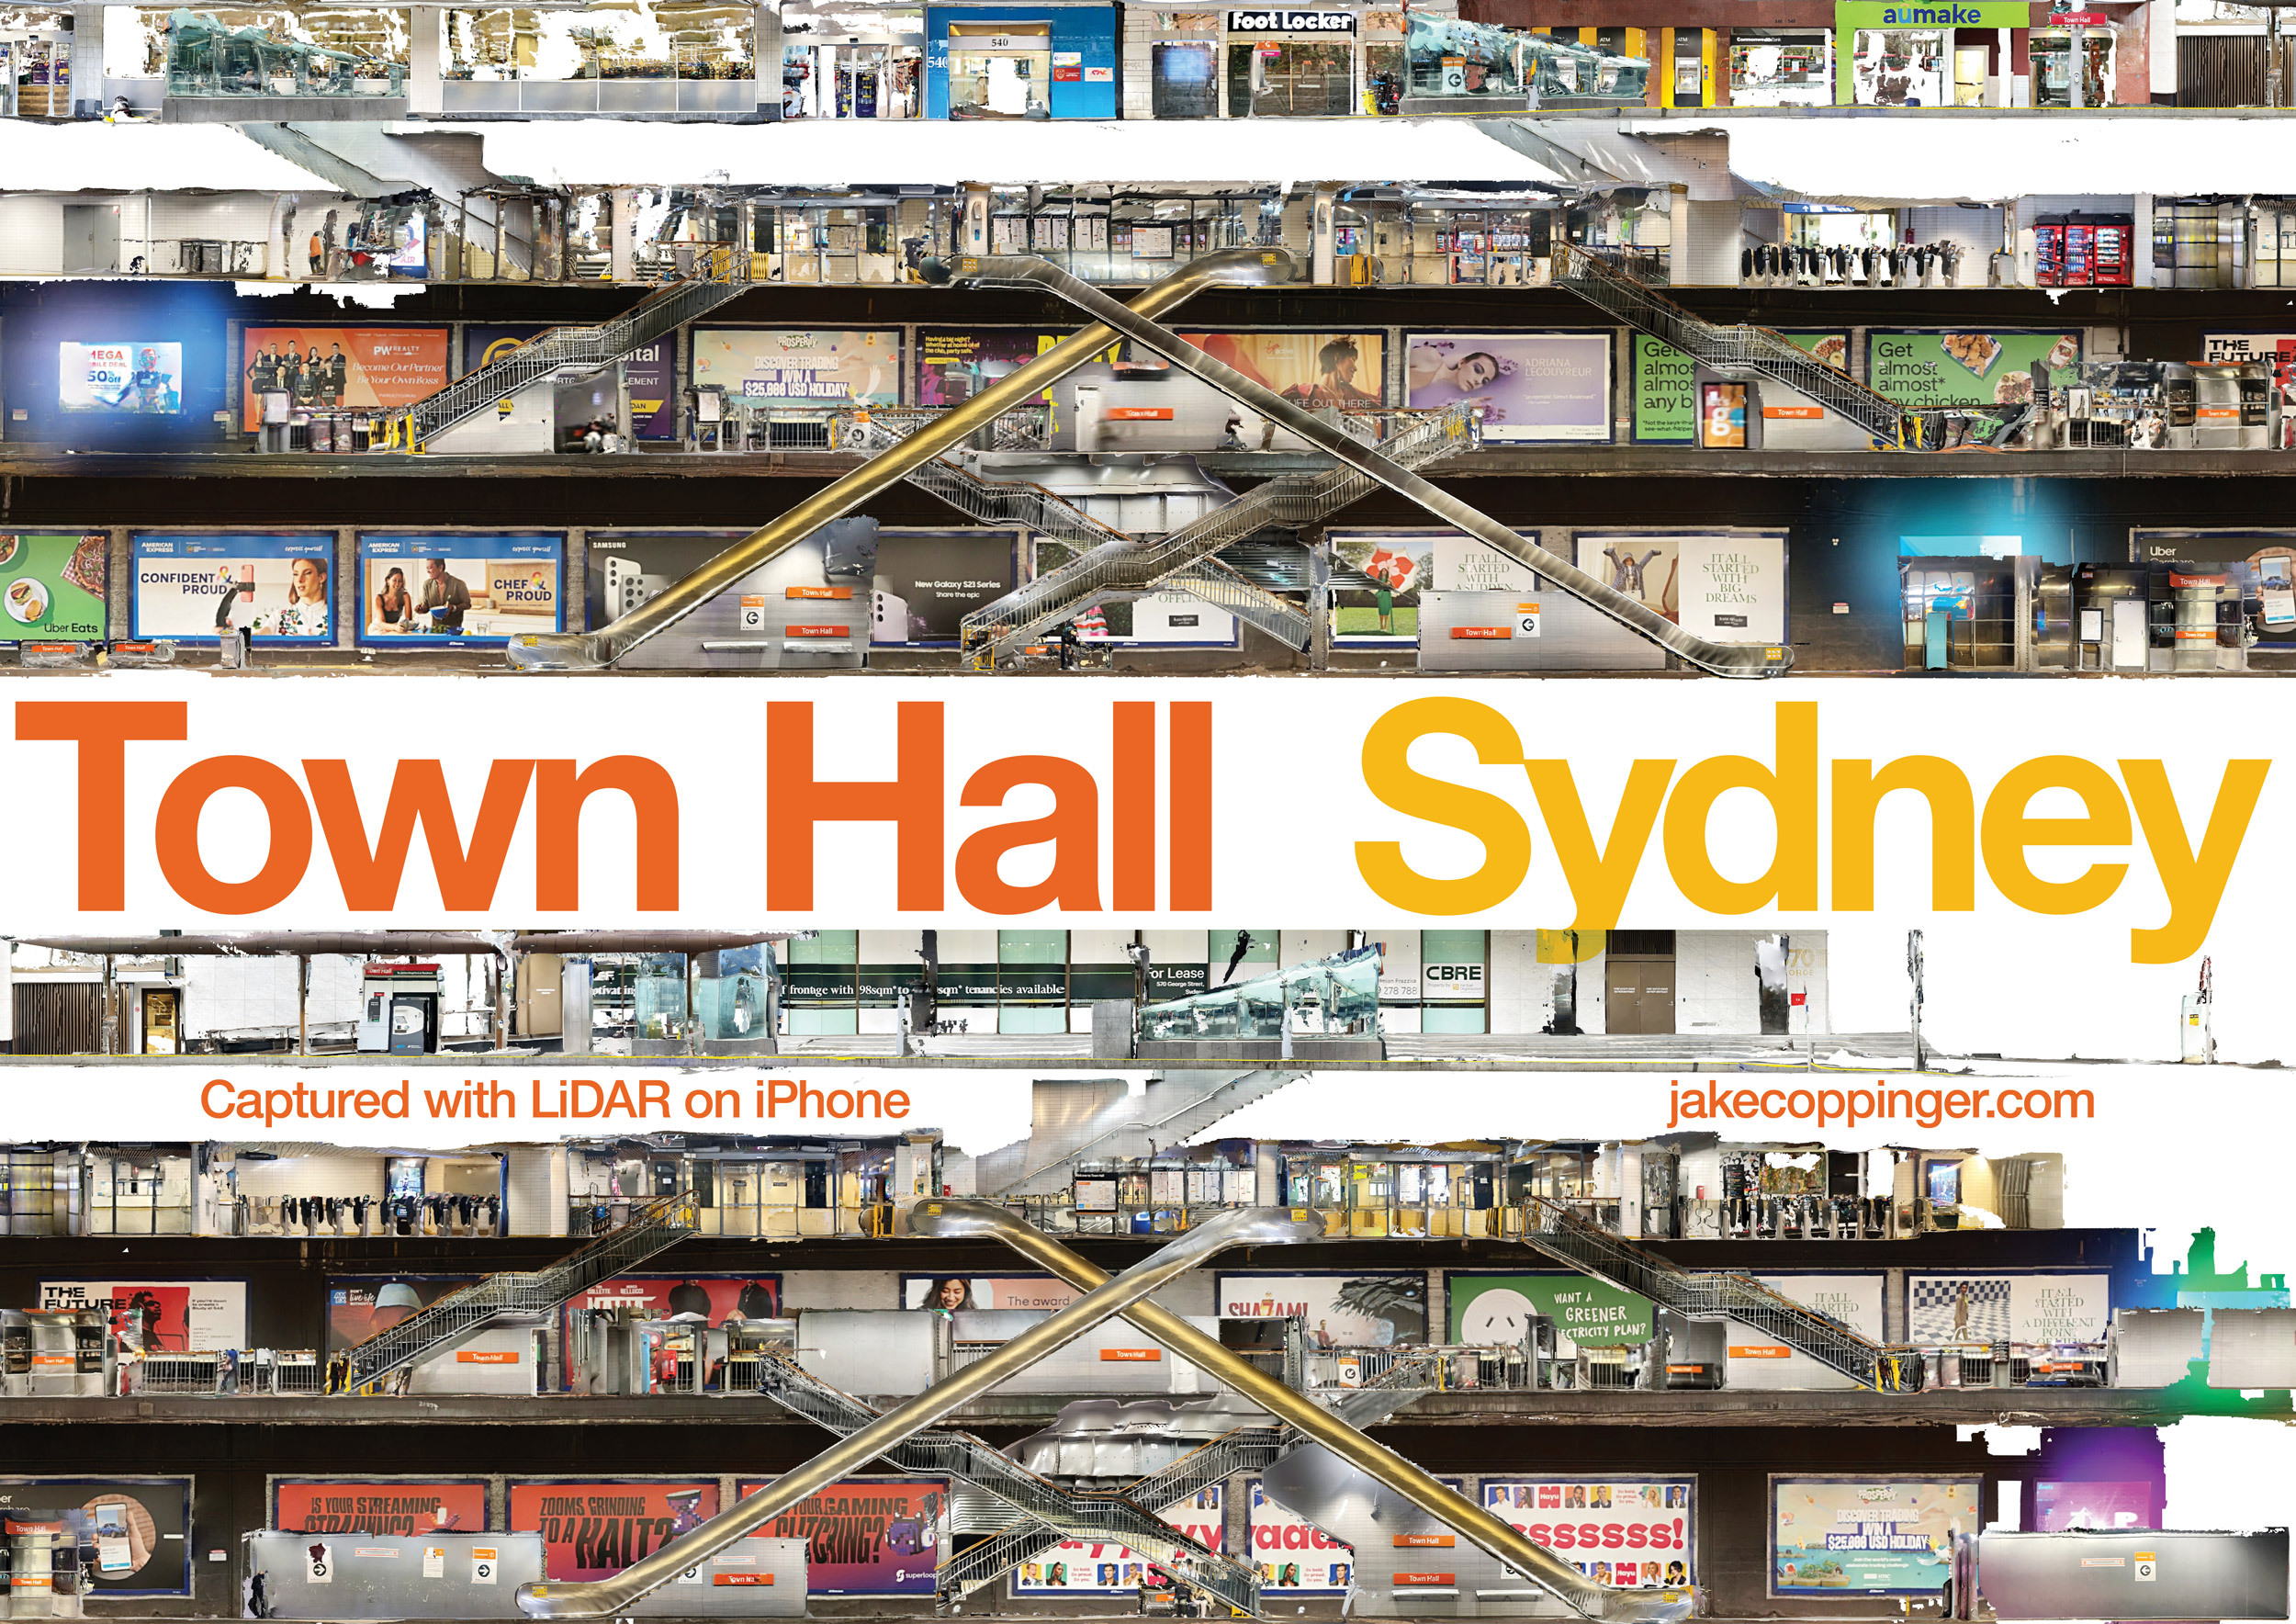
Using just an iPhone with LiDAR to create a cross-section 3D model and image of Town Hall Station with the LiDAR sensor on an iPhone.
-
Canada Bay Council plans to remove Heath St cycleway due to a misleading traffic report
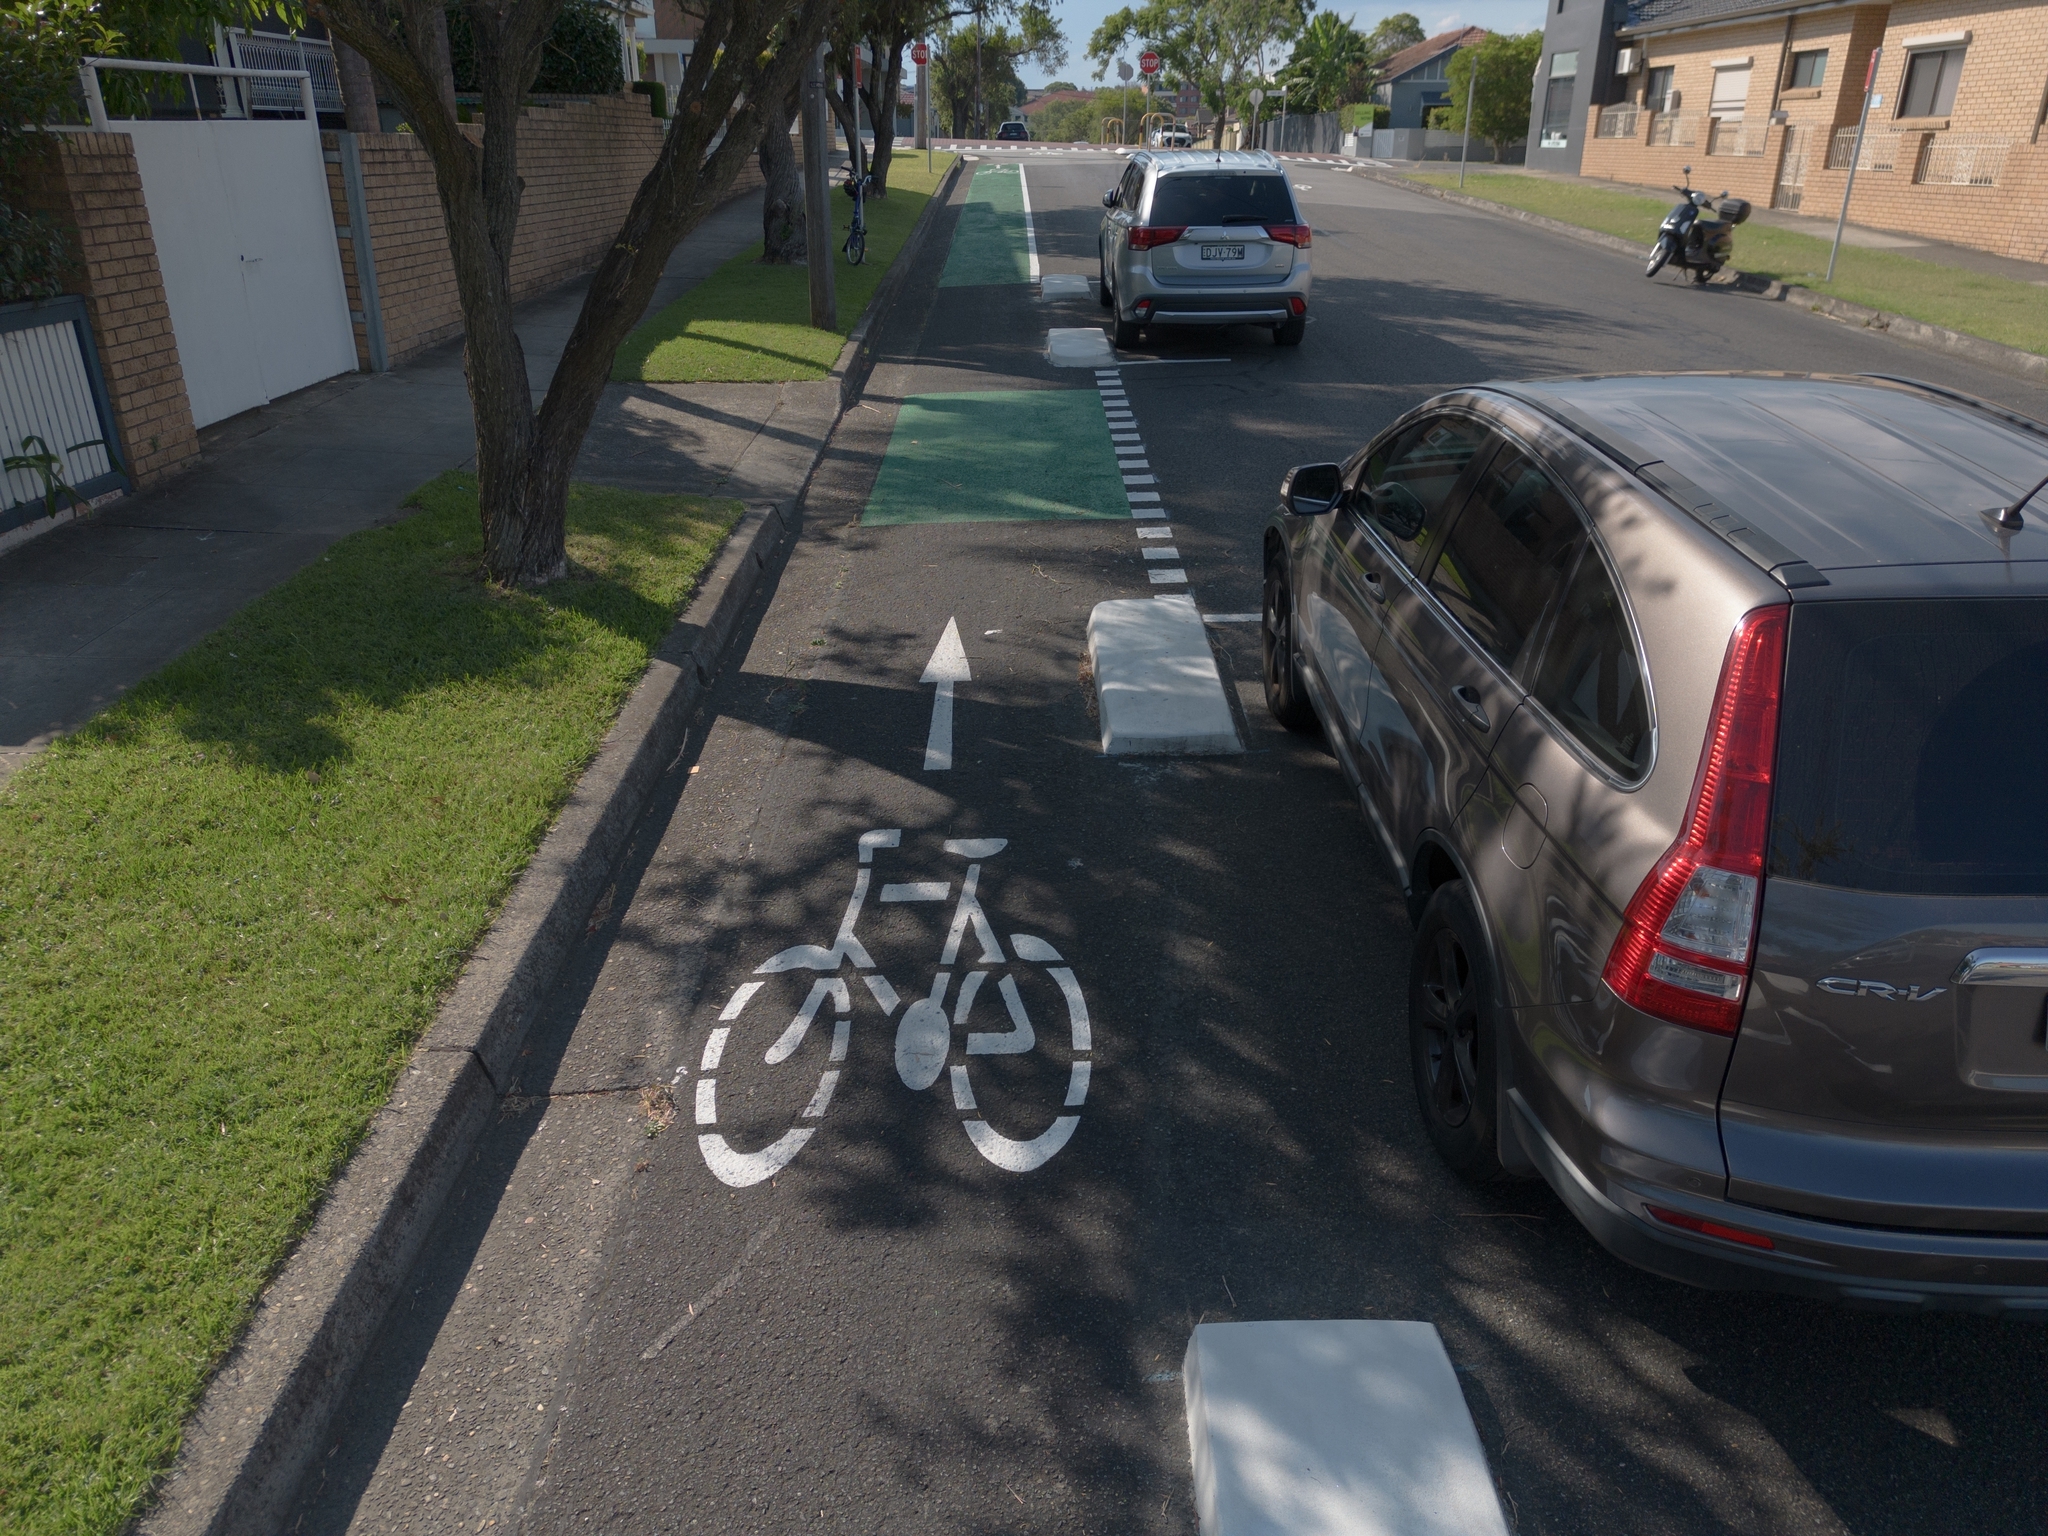
Canada Bay Council plans to remove the cycleway it received $7m of state funding for. In this analysis I outline errors and flaws in the engineering report recommending the removal (which has now been hidden from the Canada Bay Council website).
-
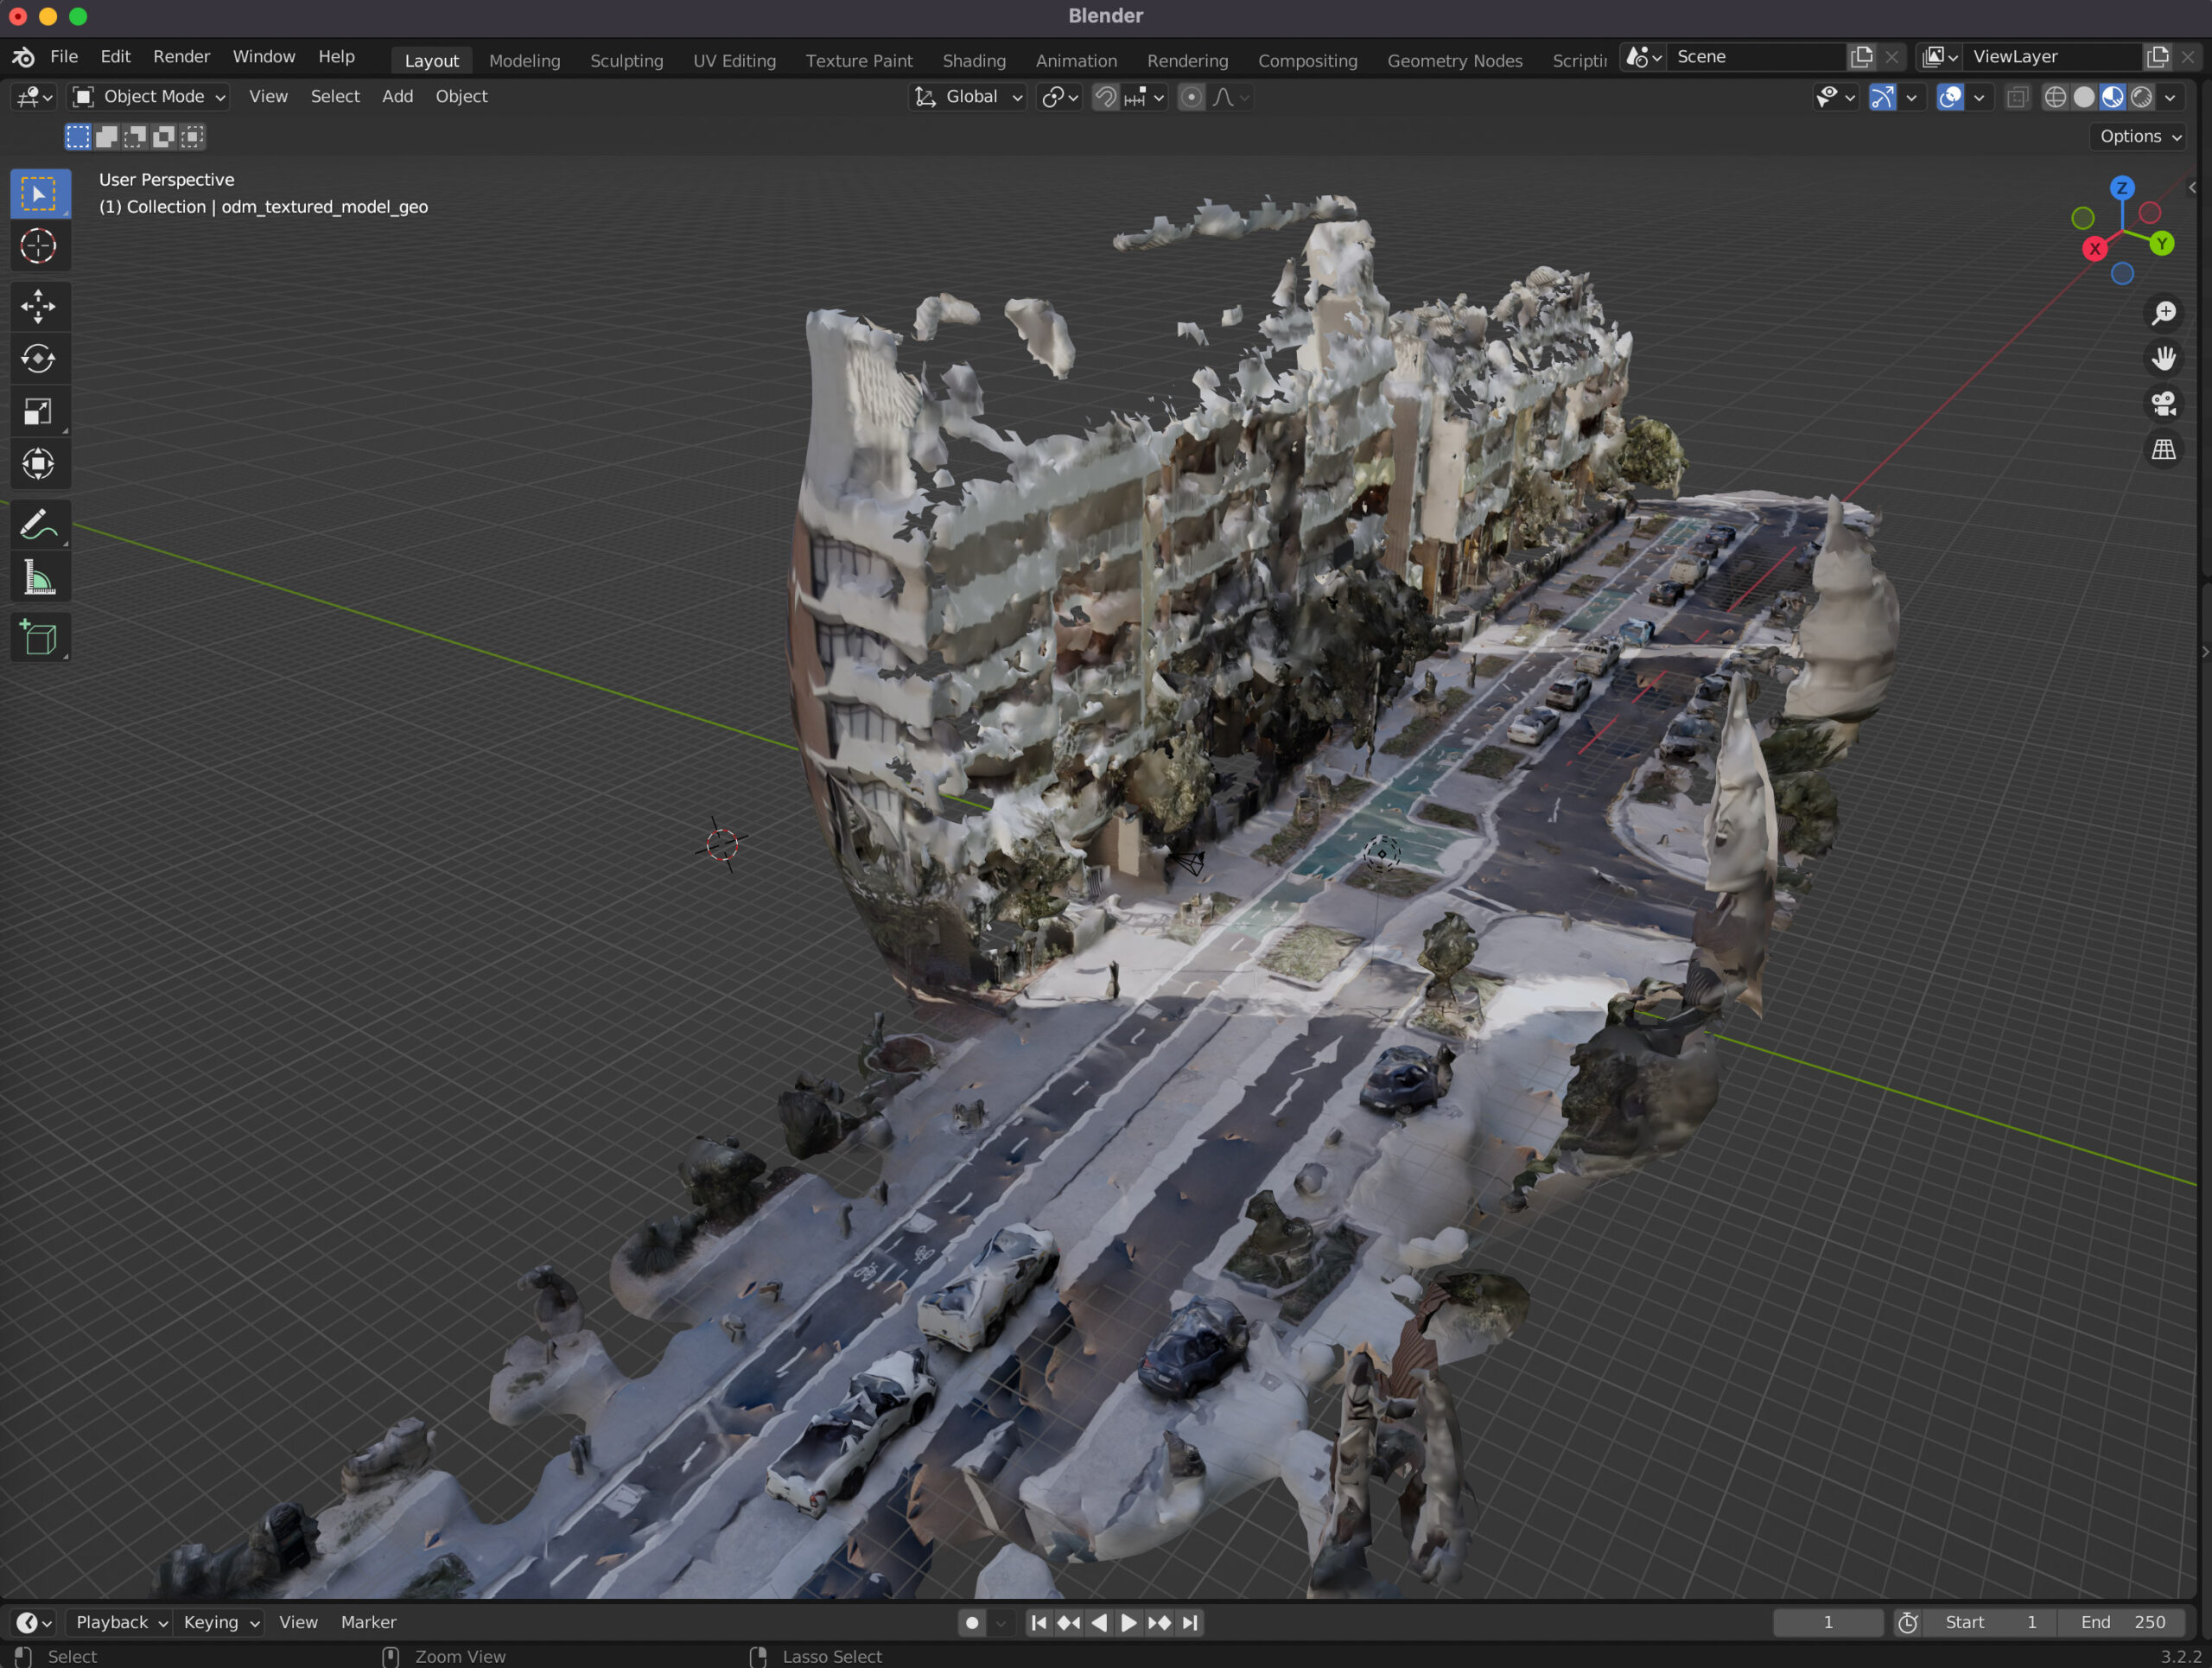
Generating aerial imagery with your iPhone’s LiDAR sensor
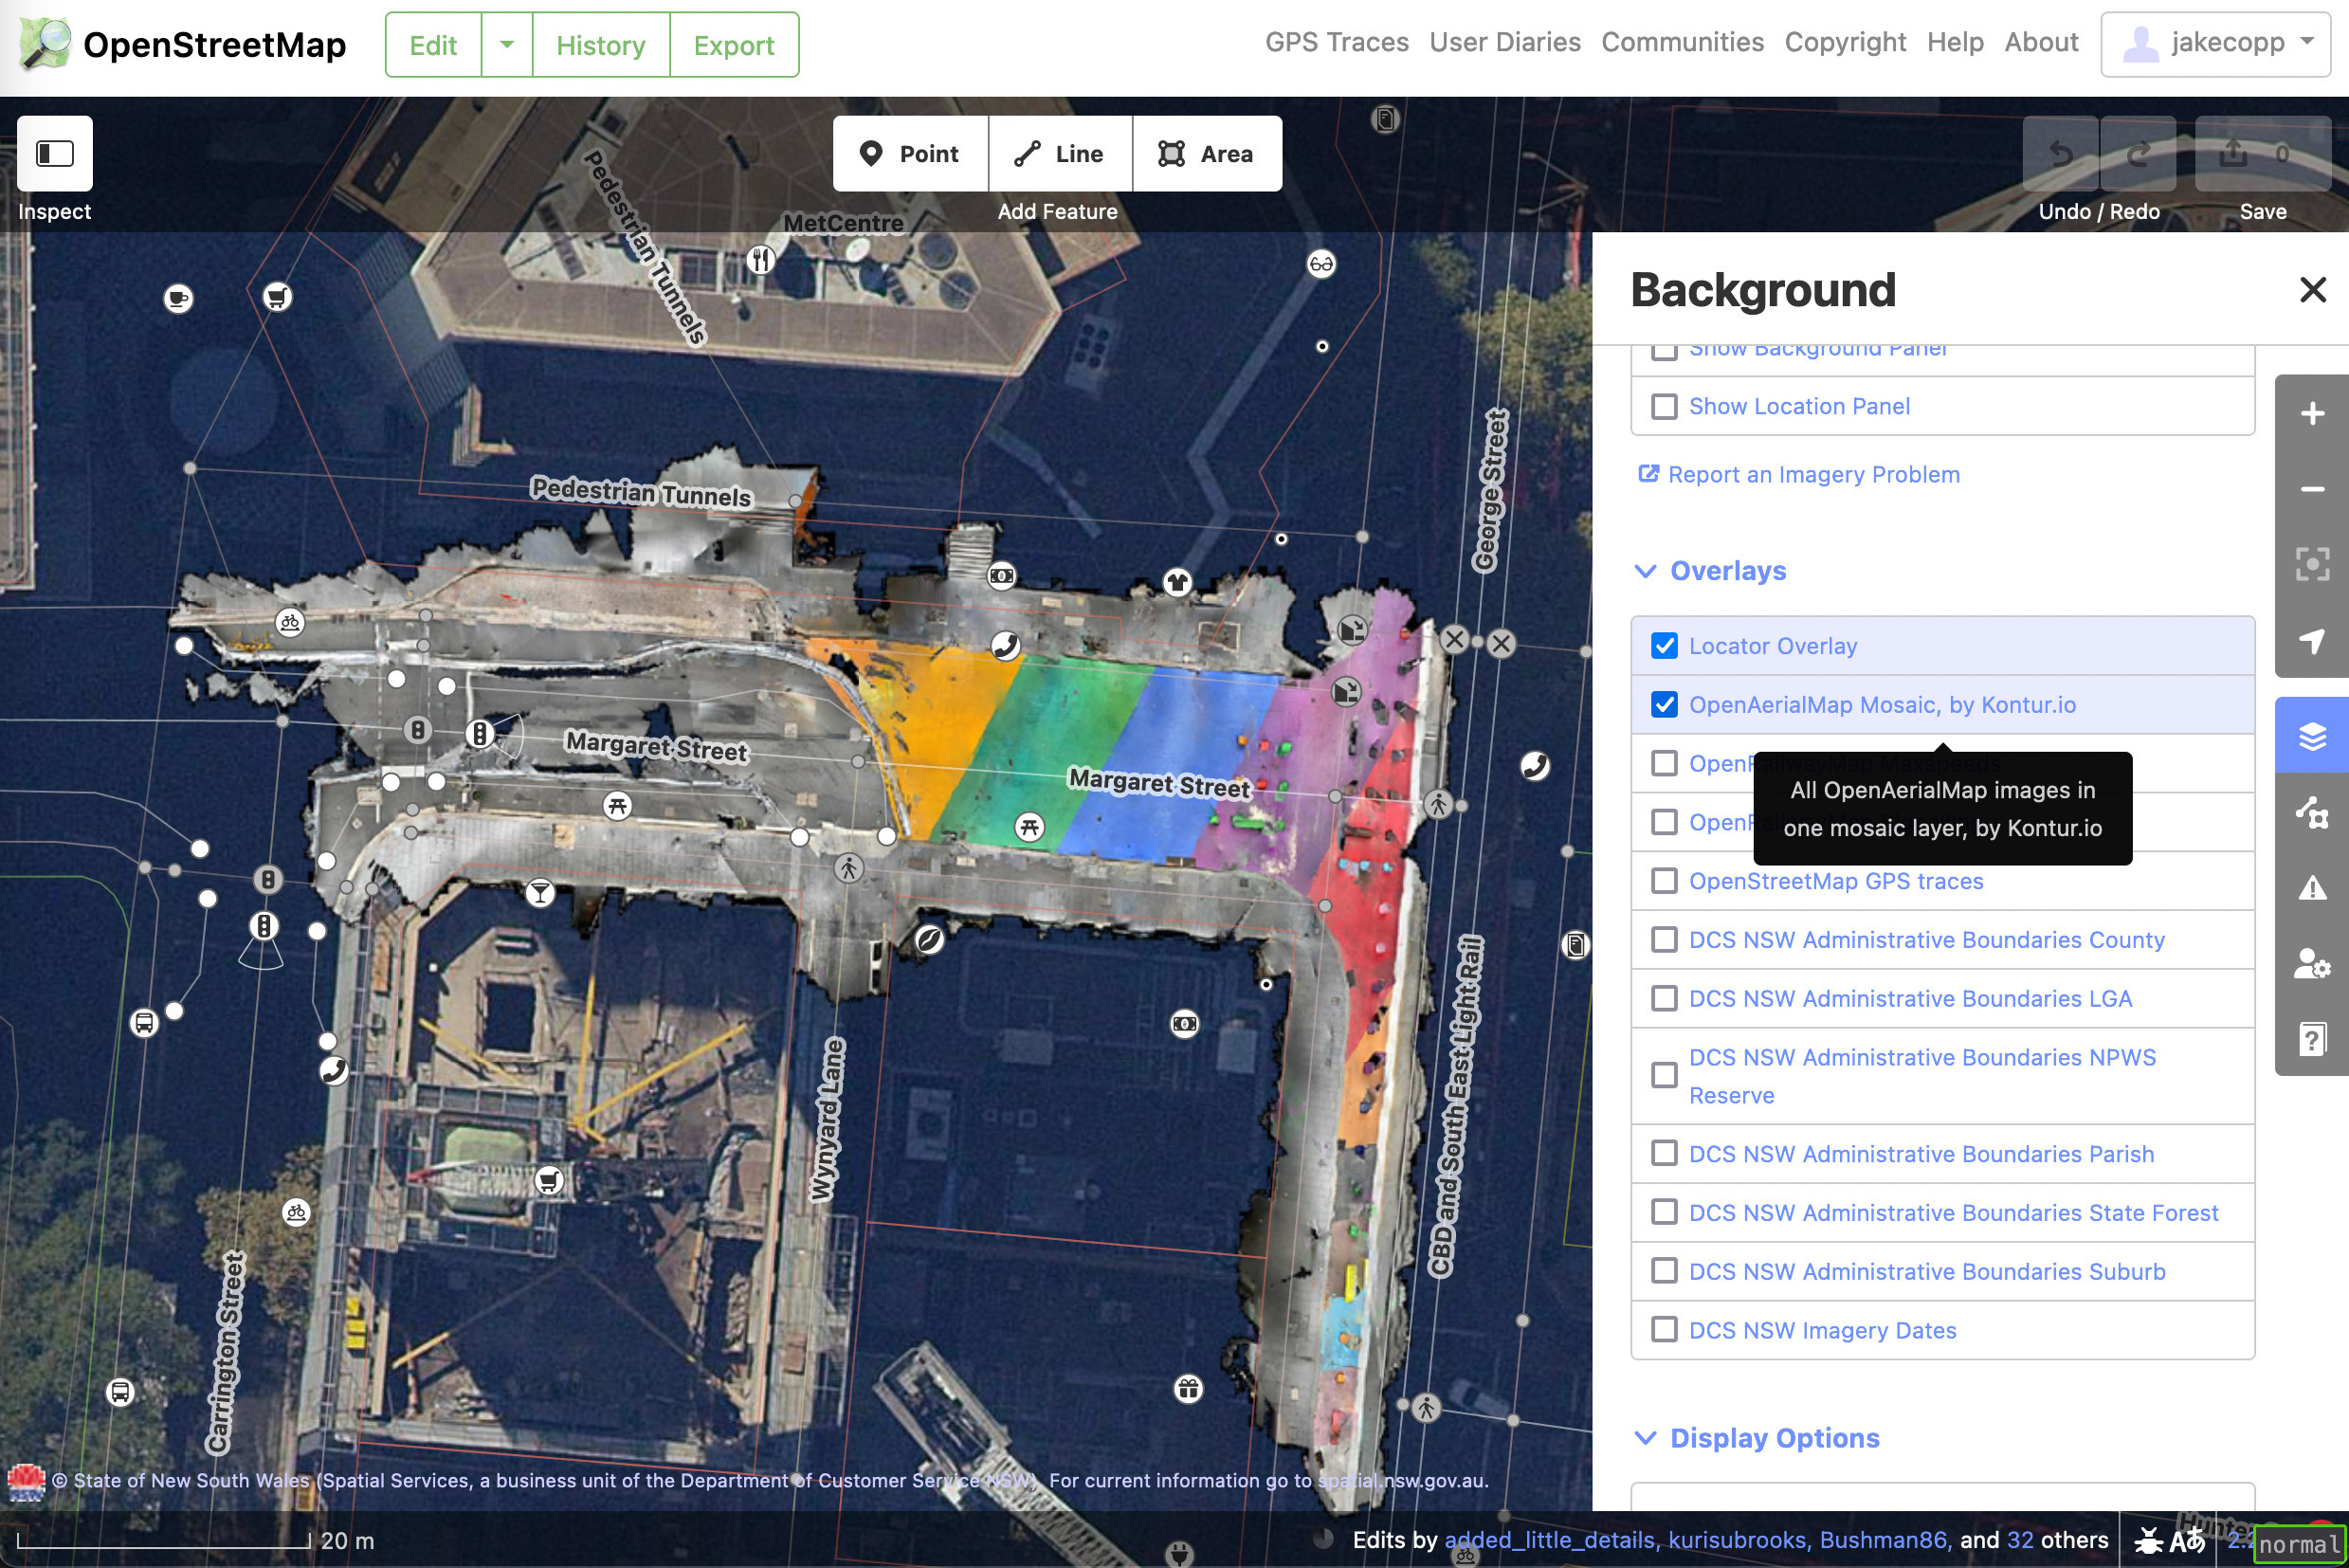
This technical guide details how you can create your own aerial imagery and 3D models of streets with the built in iPhone LiDAR sensor and open source tools in the OpenDroneMap package.
-
Sydney CBD is bringing back pedestrian “beg buttons”
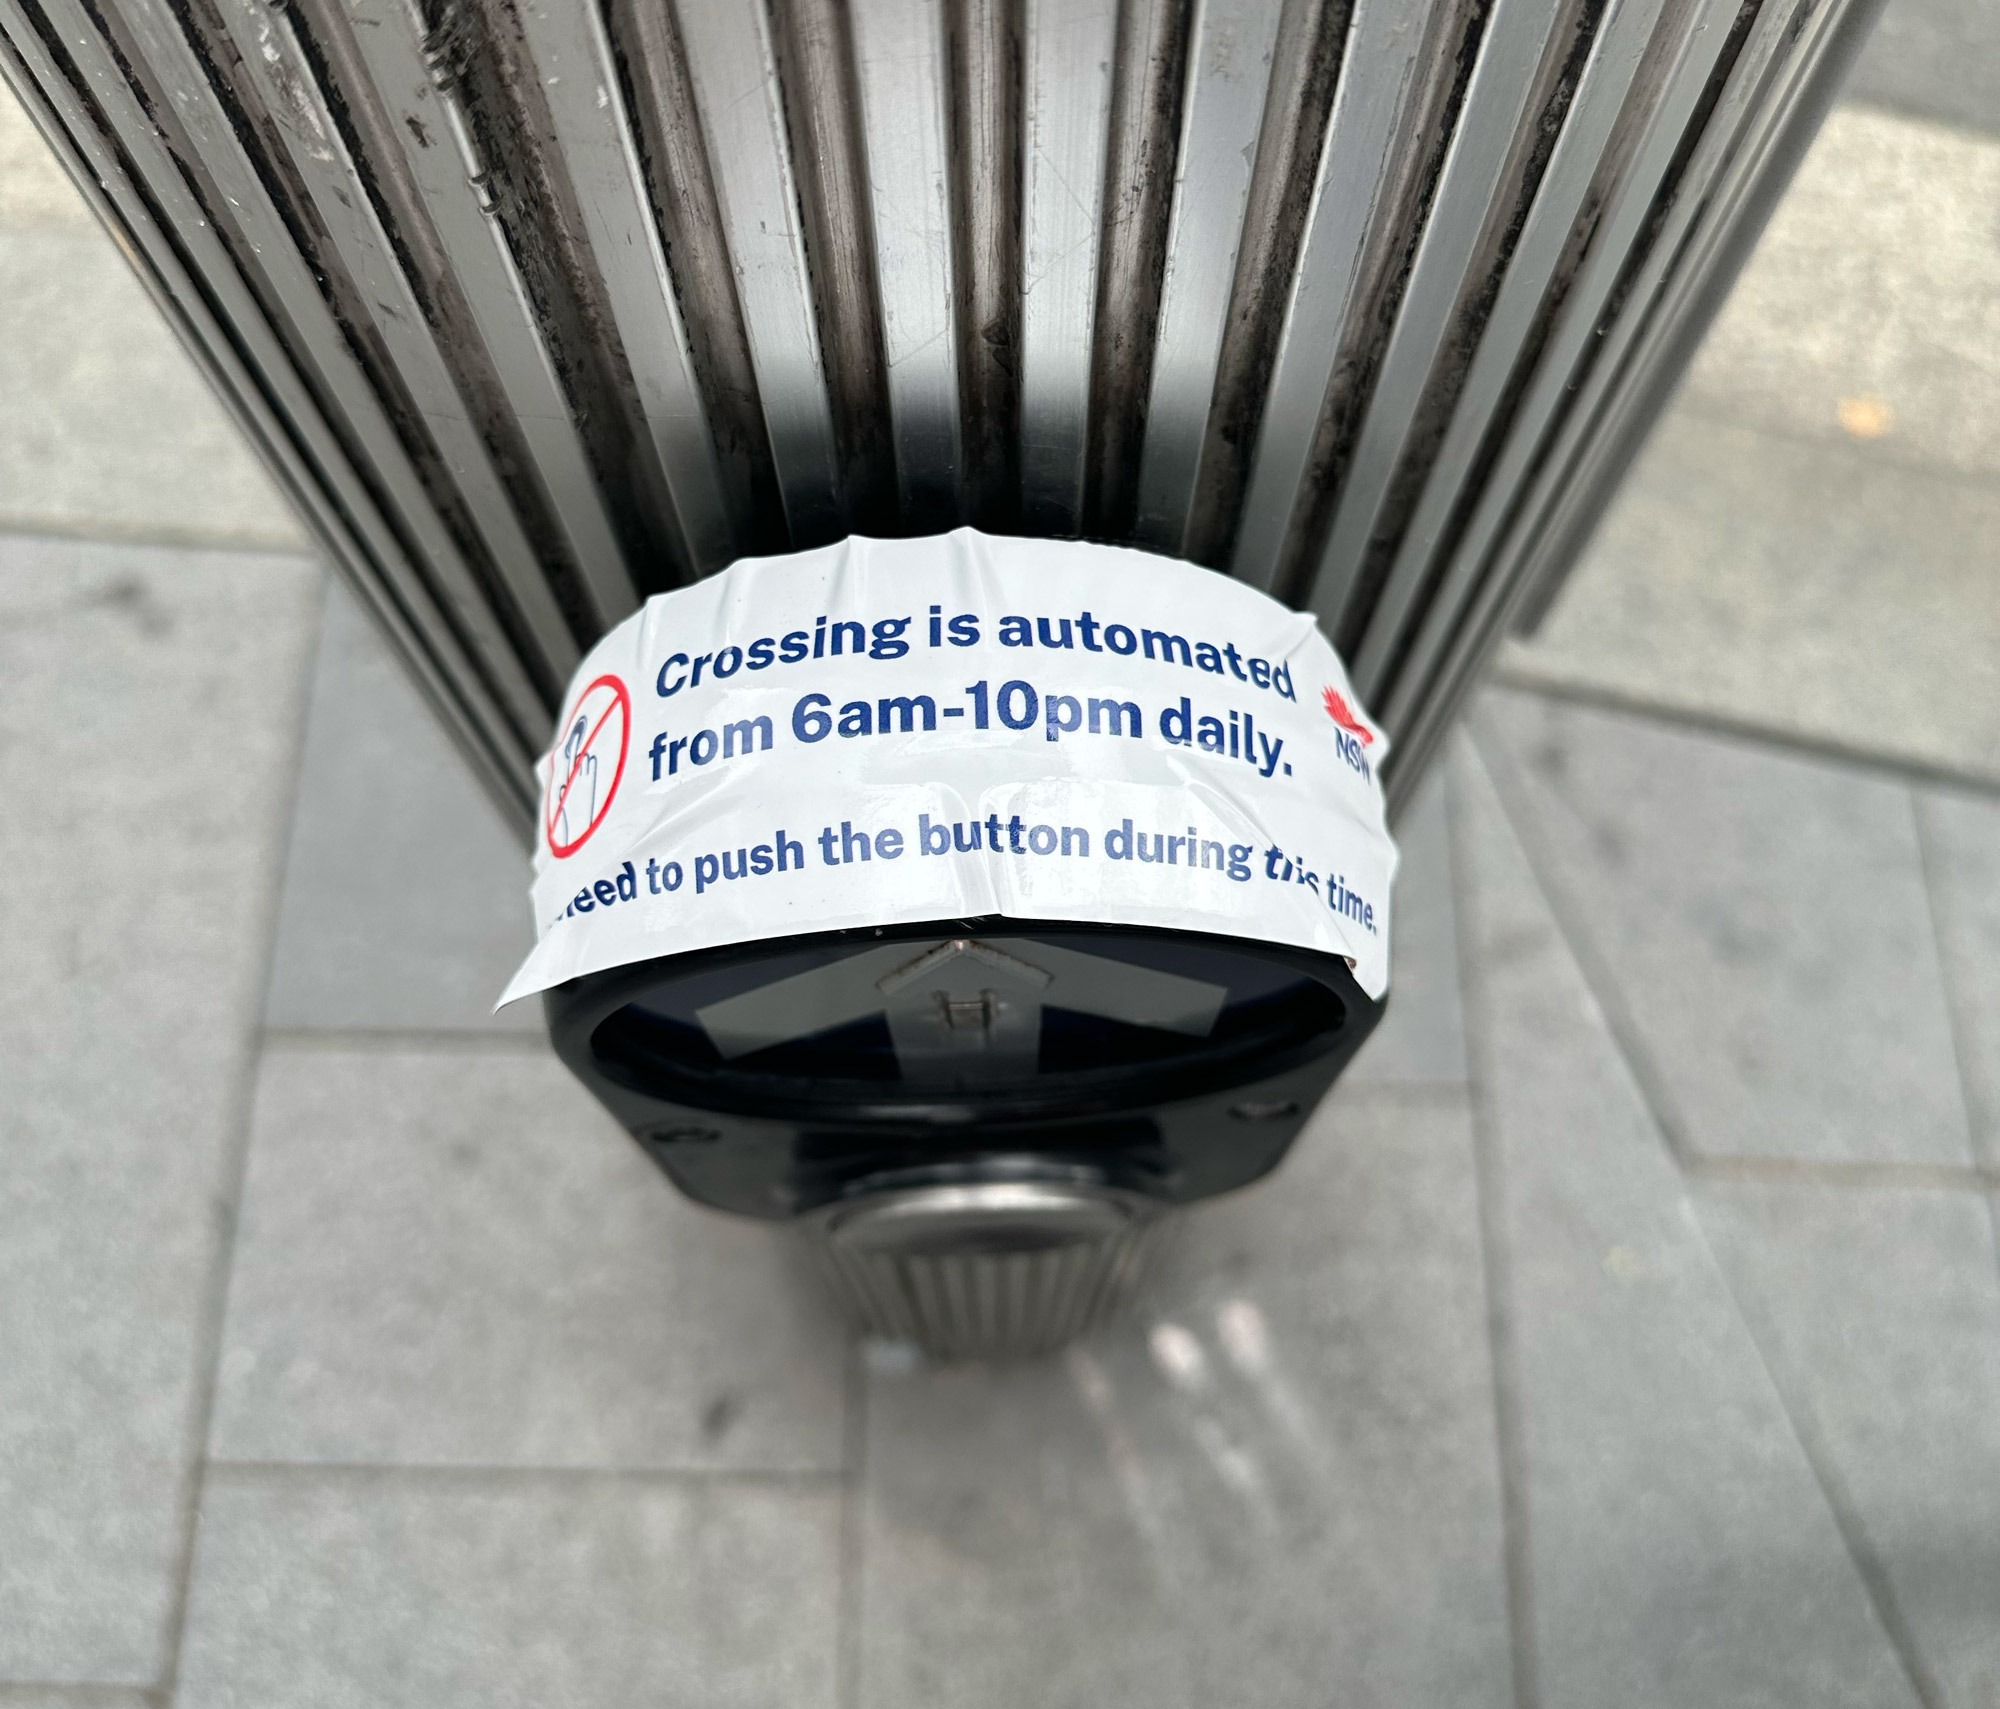
TfNSW have recently installed these around the Sydney CBD – a sticker on top of a pedestrian “beg button” explaining the button is redundant before 6am and after 10pm.
-
Creating aerial imagery with a bike helmet camera (GoPro) and OpenDroneMap
This technical guide details how you can create your own orthorectified (aka satellite view/bird mode) imagery, point clouds and 3D models of streets with nothing but a 360 degree camera mounted on bicycle helmet, and the open source photogrammetry software OpenDroneMap.
-
Observations from Australia’s first Micromobility Conference
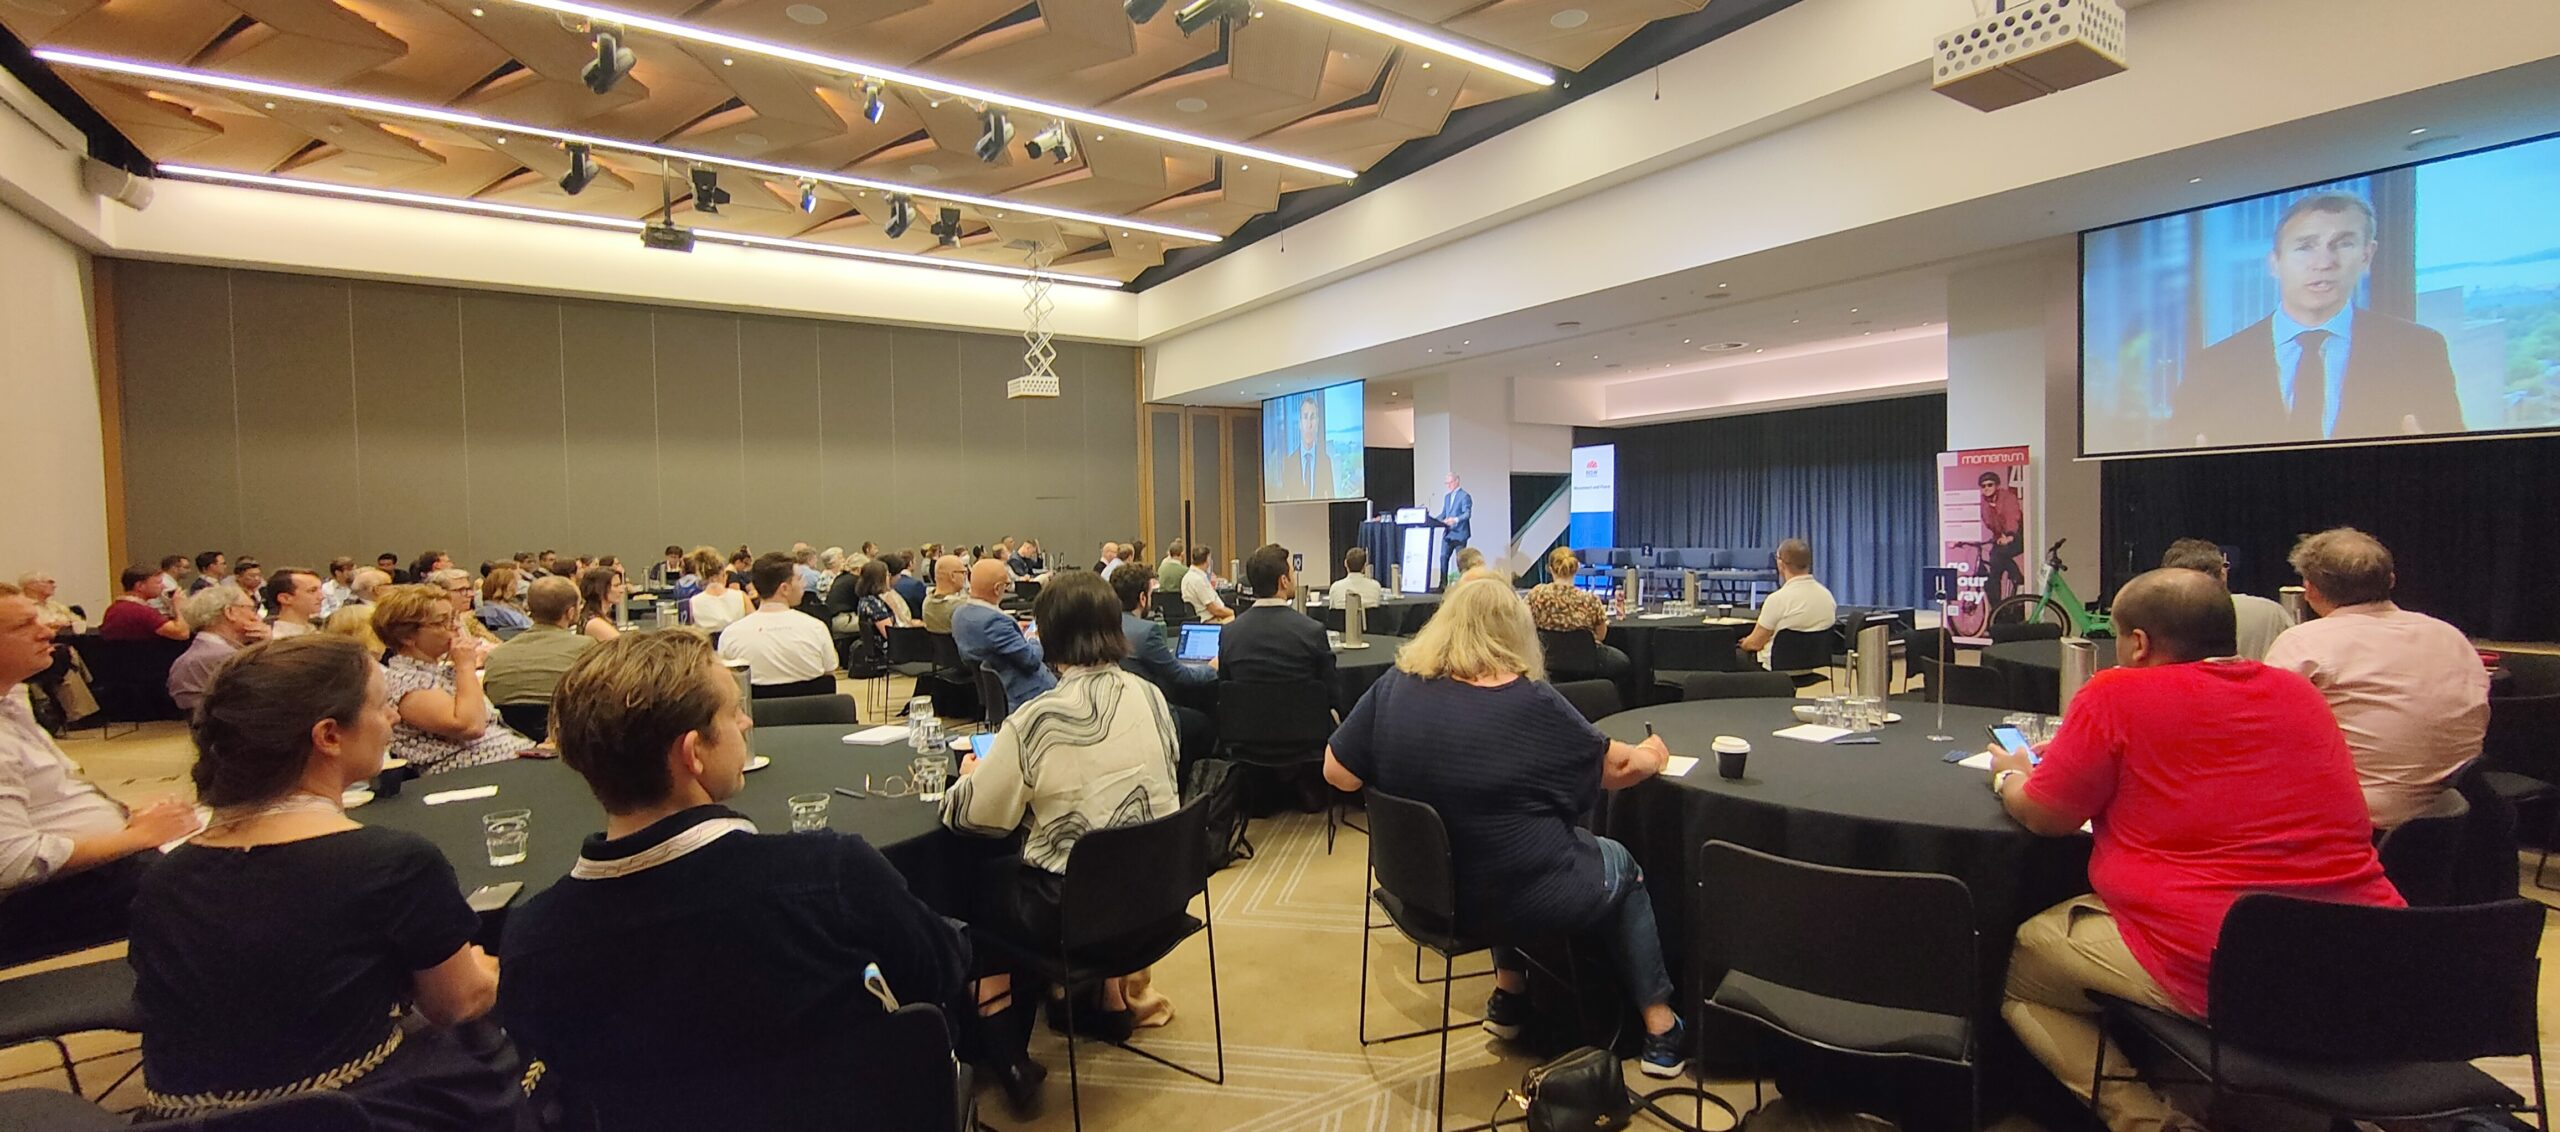
Over the weekend I attended Australia’s first micromobility conference. The sessions were organised into themes reflecting the challenges Australia faces in transitioning it’s transport network and urban planning – from car and highway dominated streets to a safer, lower emission and more pleasant city permitting cycling, walking and other journeys.
-
Visualising Sydney bus congestion with Marey charts
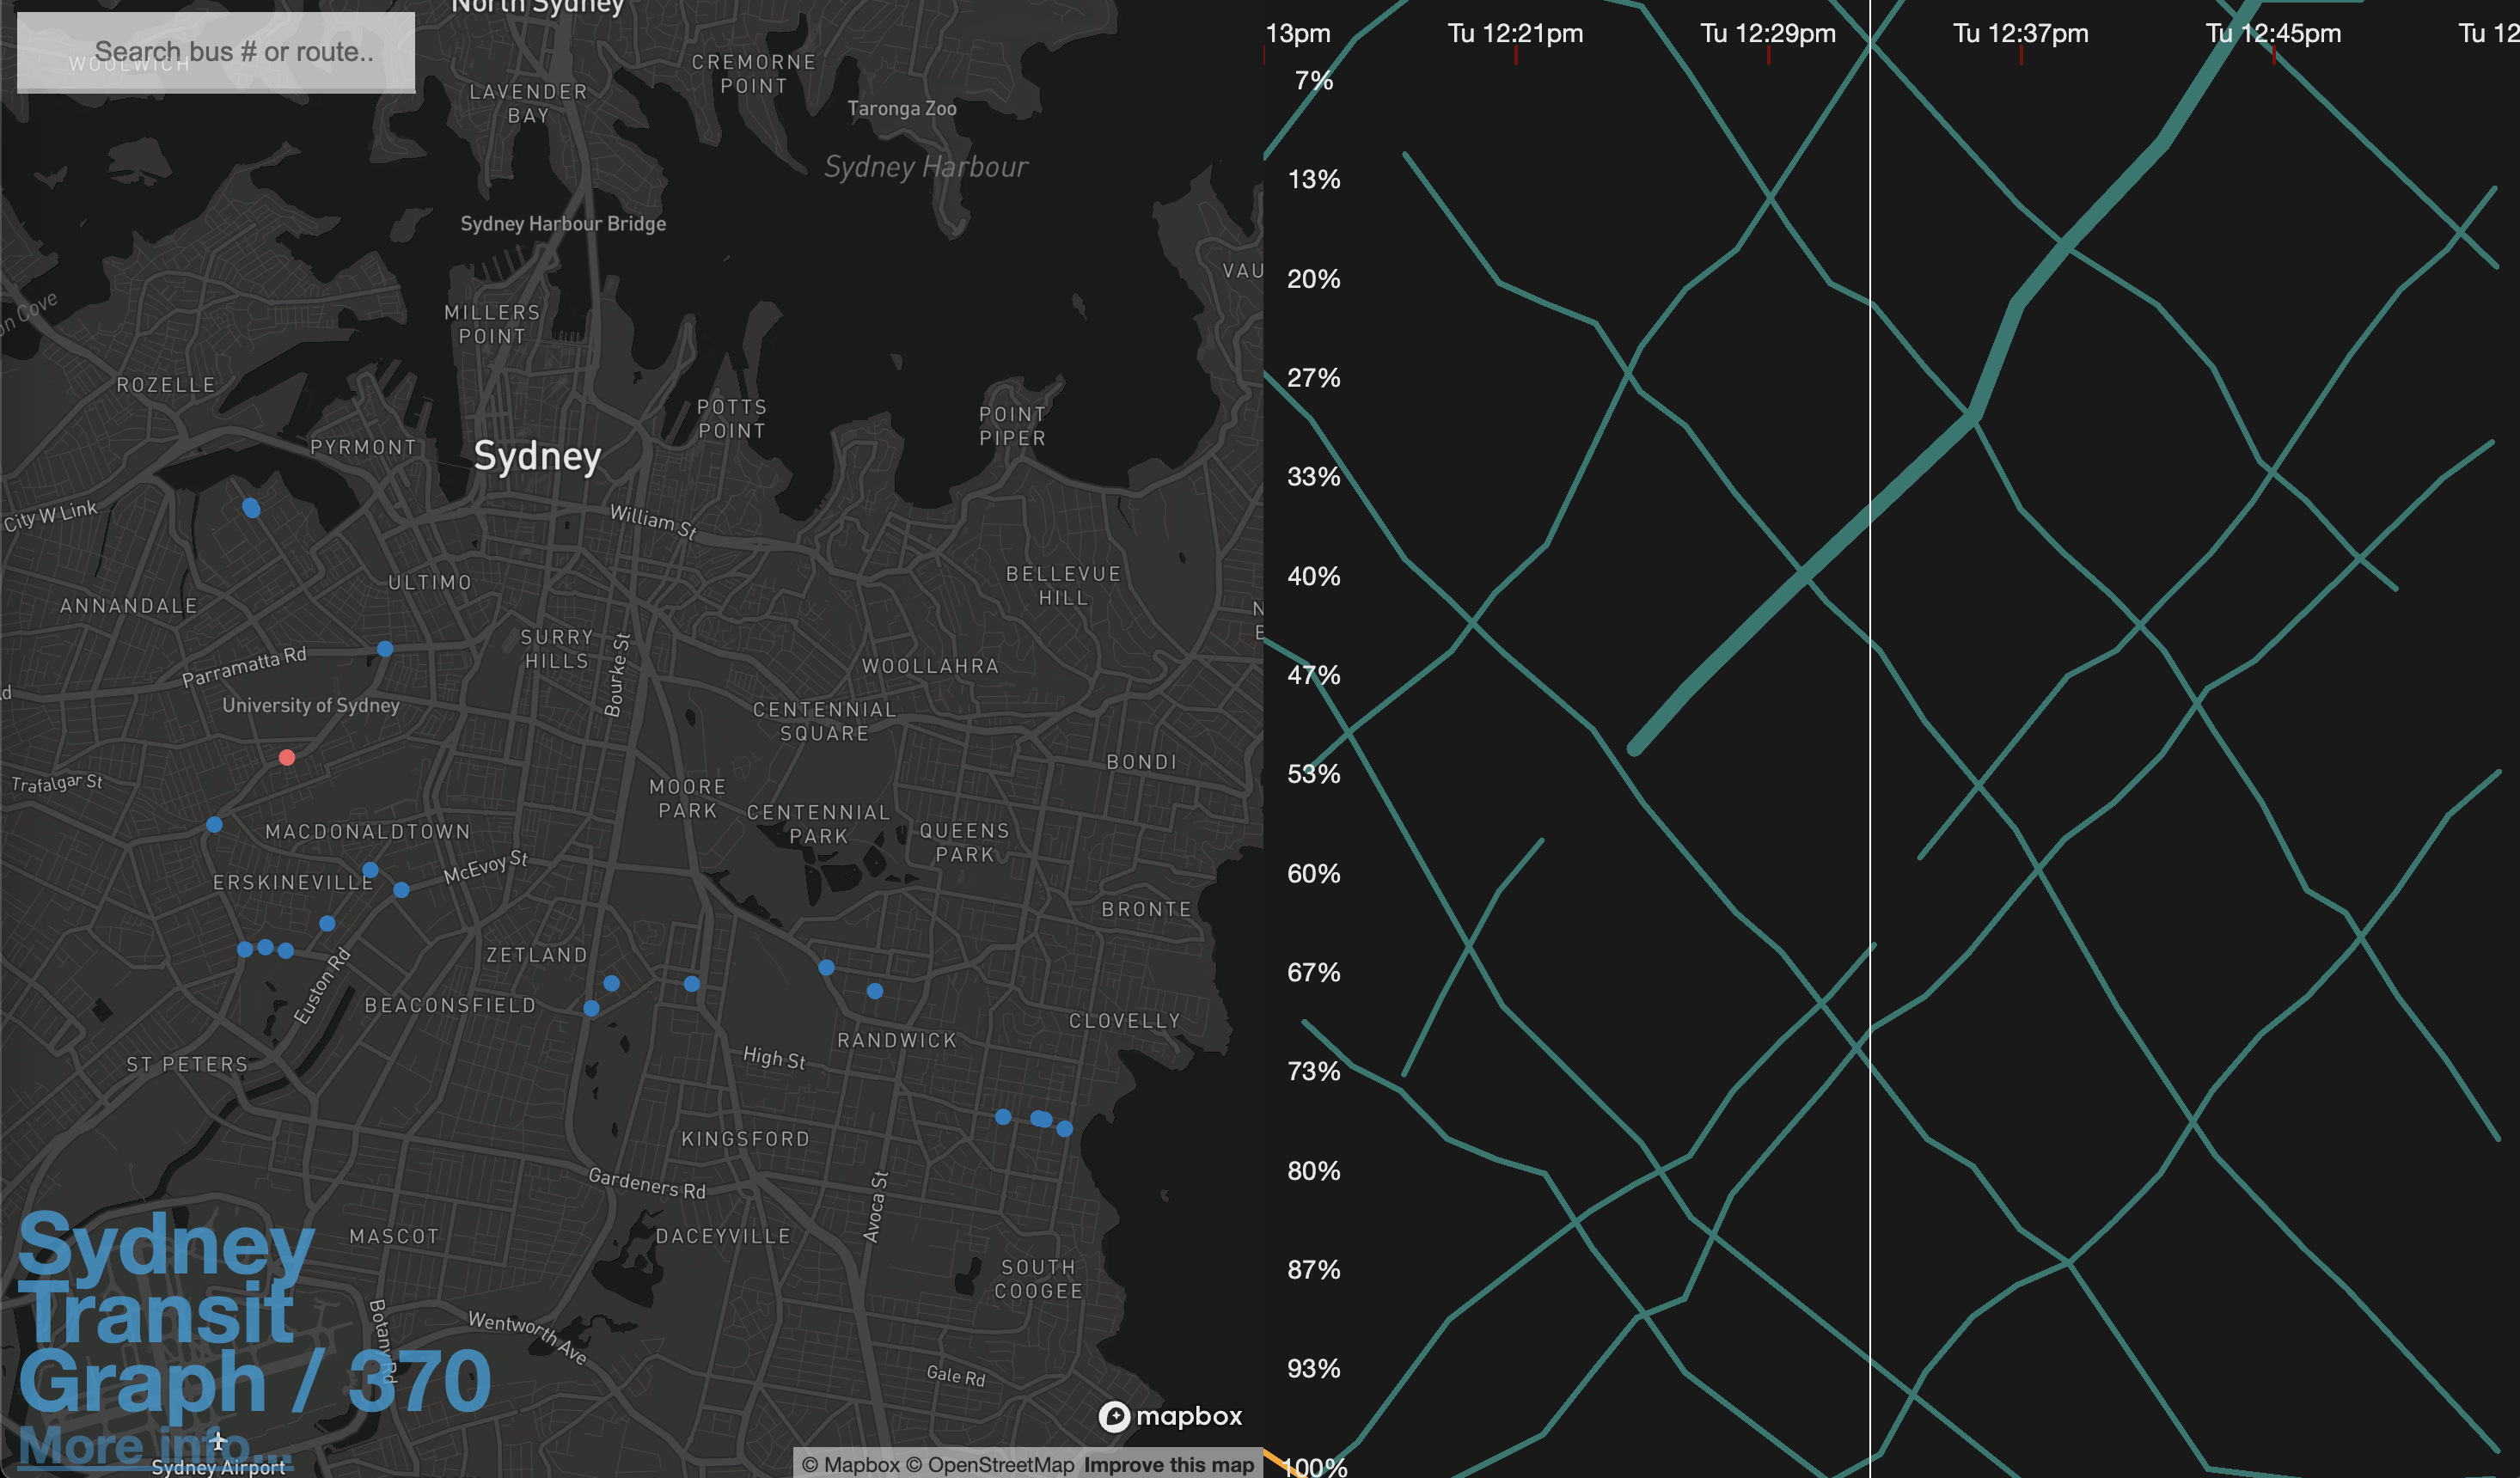
As a side project I built Sydney Transit Graph – a visualisation of real-time Sydney bus congestion. Each line on the graph (a Marey chart) represents a bus completing its route (percentage) over time.
-
Mapping Sydney Billboards: Every QMS advertising panel in Sydney
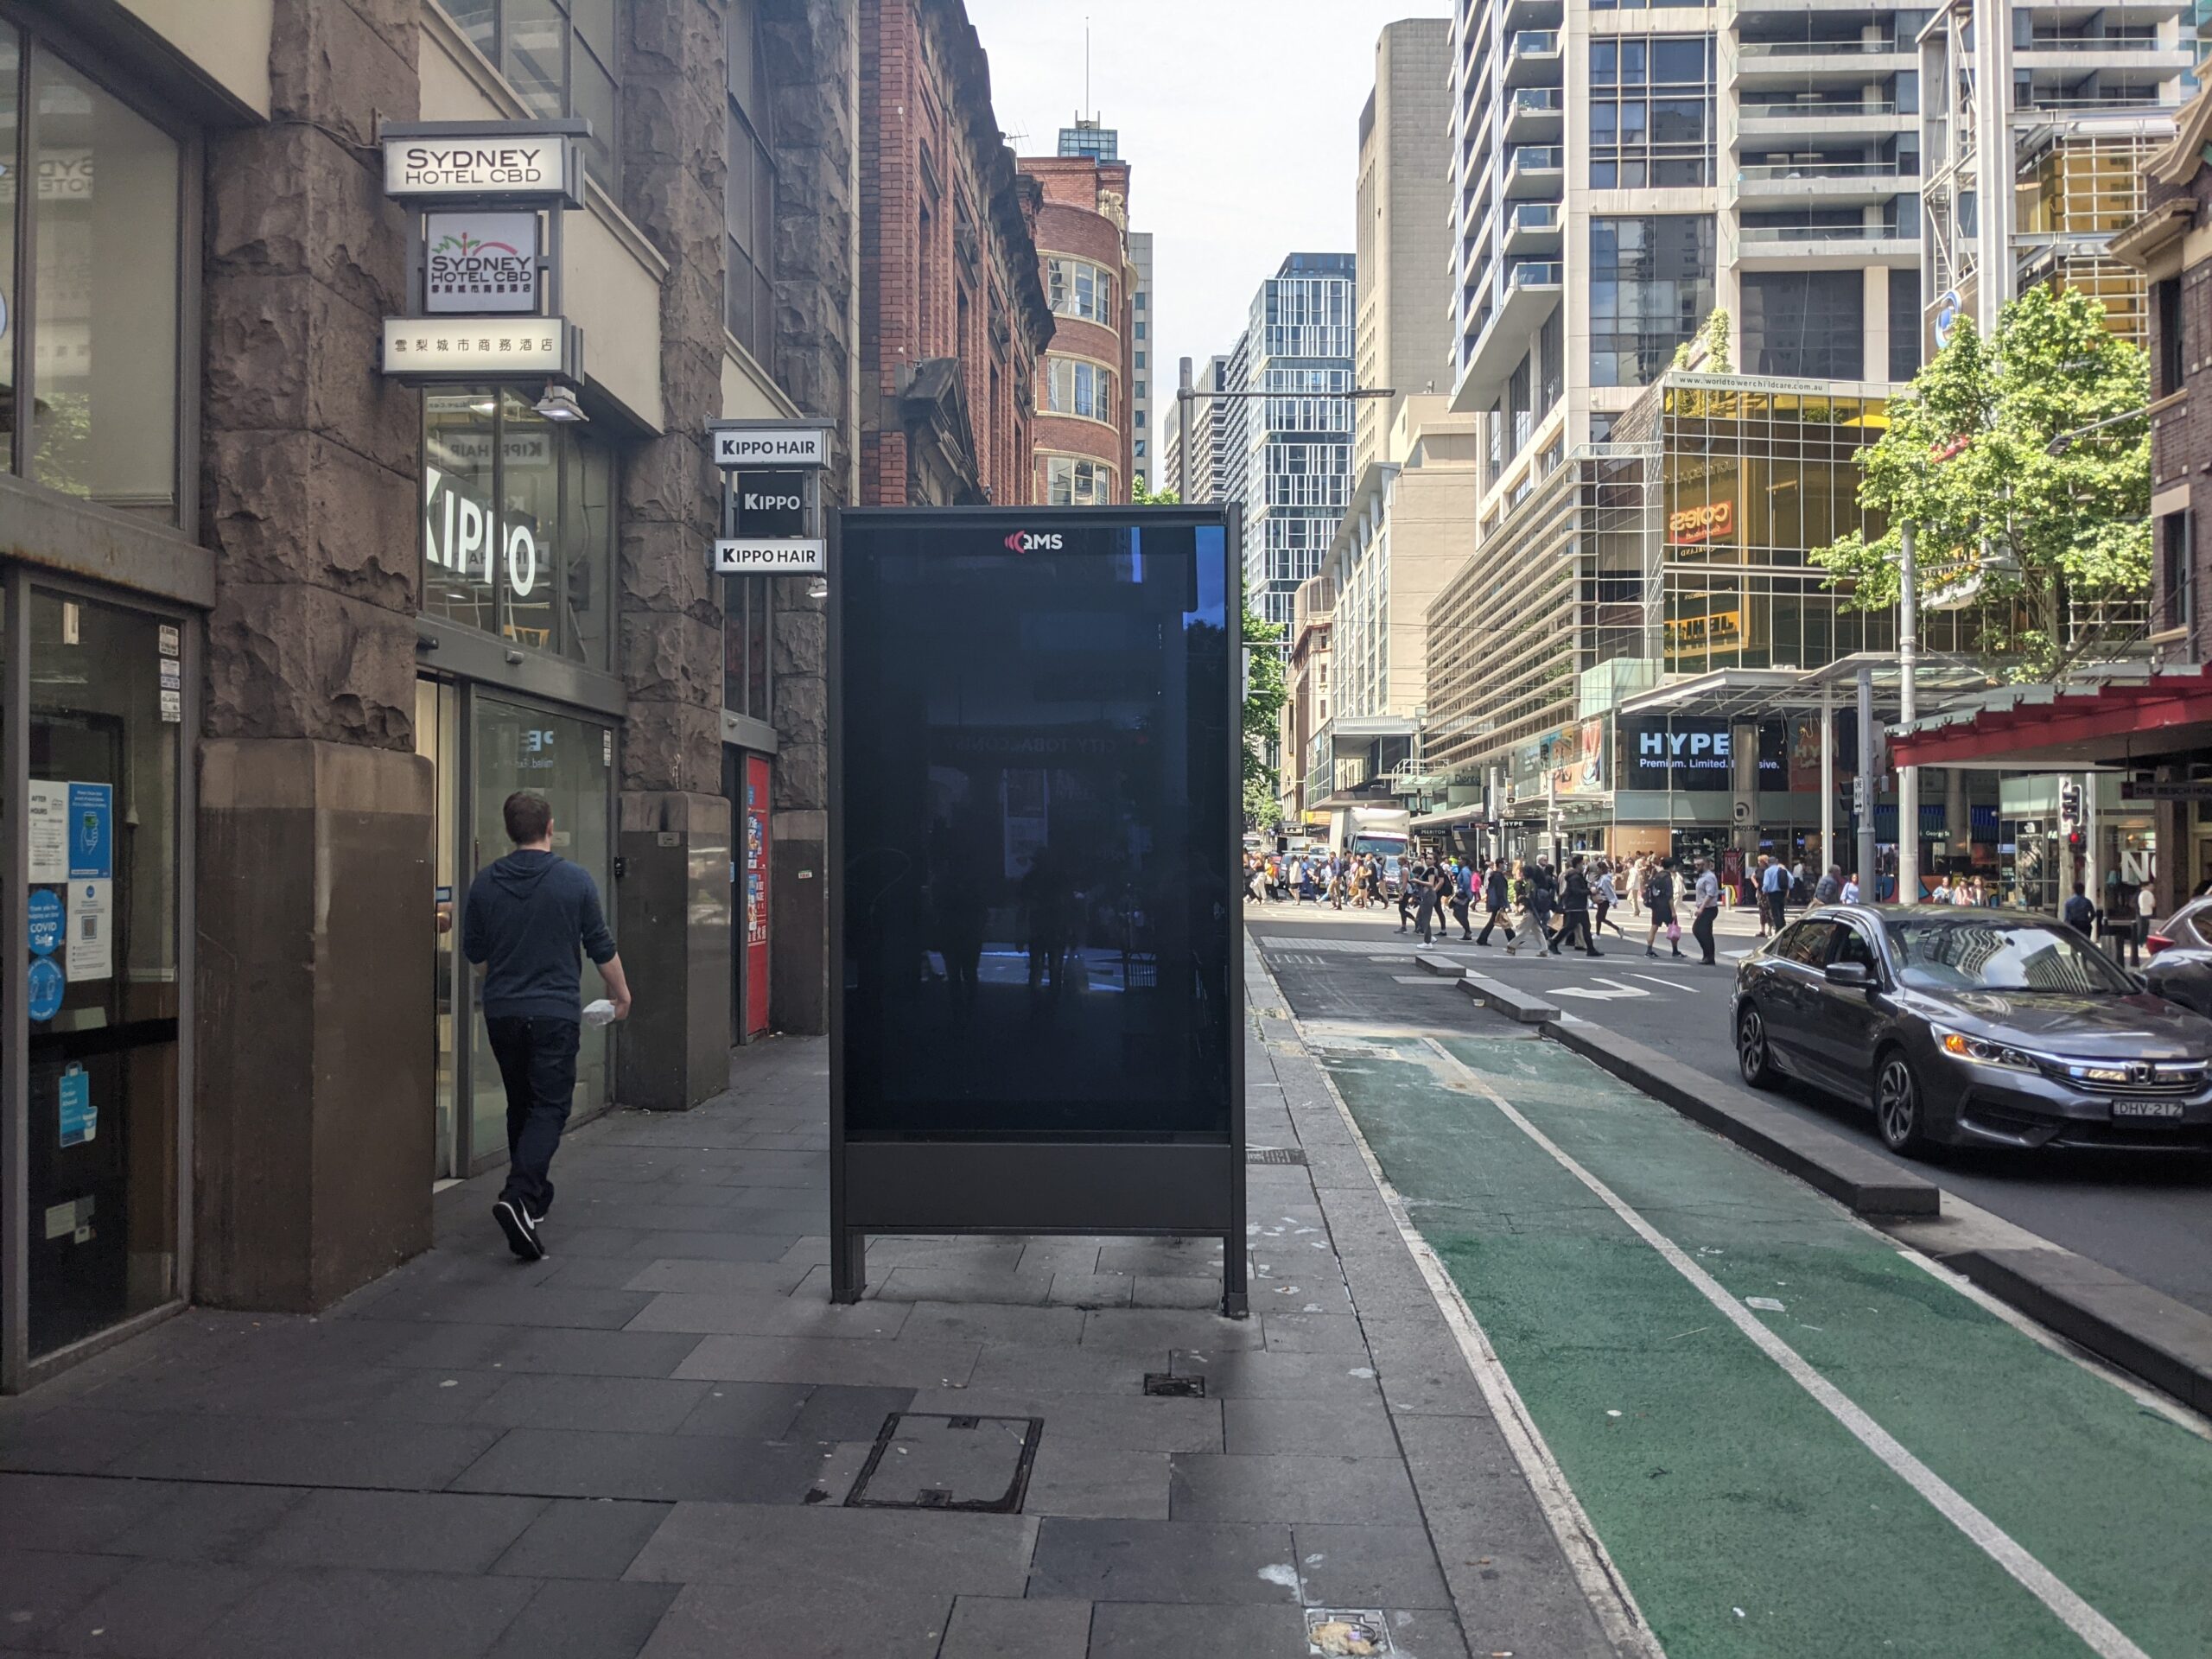
Map live at SydneyAdvertisingMap.com. See also: Max Bo’s analysis of how many placed next to Telstra telephones: https://observablehq.com/@mjbo/sydney-qms-panel-public-telephone-pairings If you live in Sydney you will have seen them – the 86 inch advertising screens in the City of Sydney Council. These advertising panels are known as communication pylons in the language of the developer approvals.…
-
The Drying Green opening – a new Green Square park
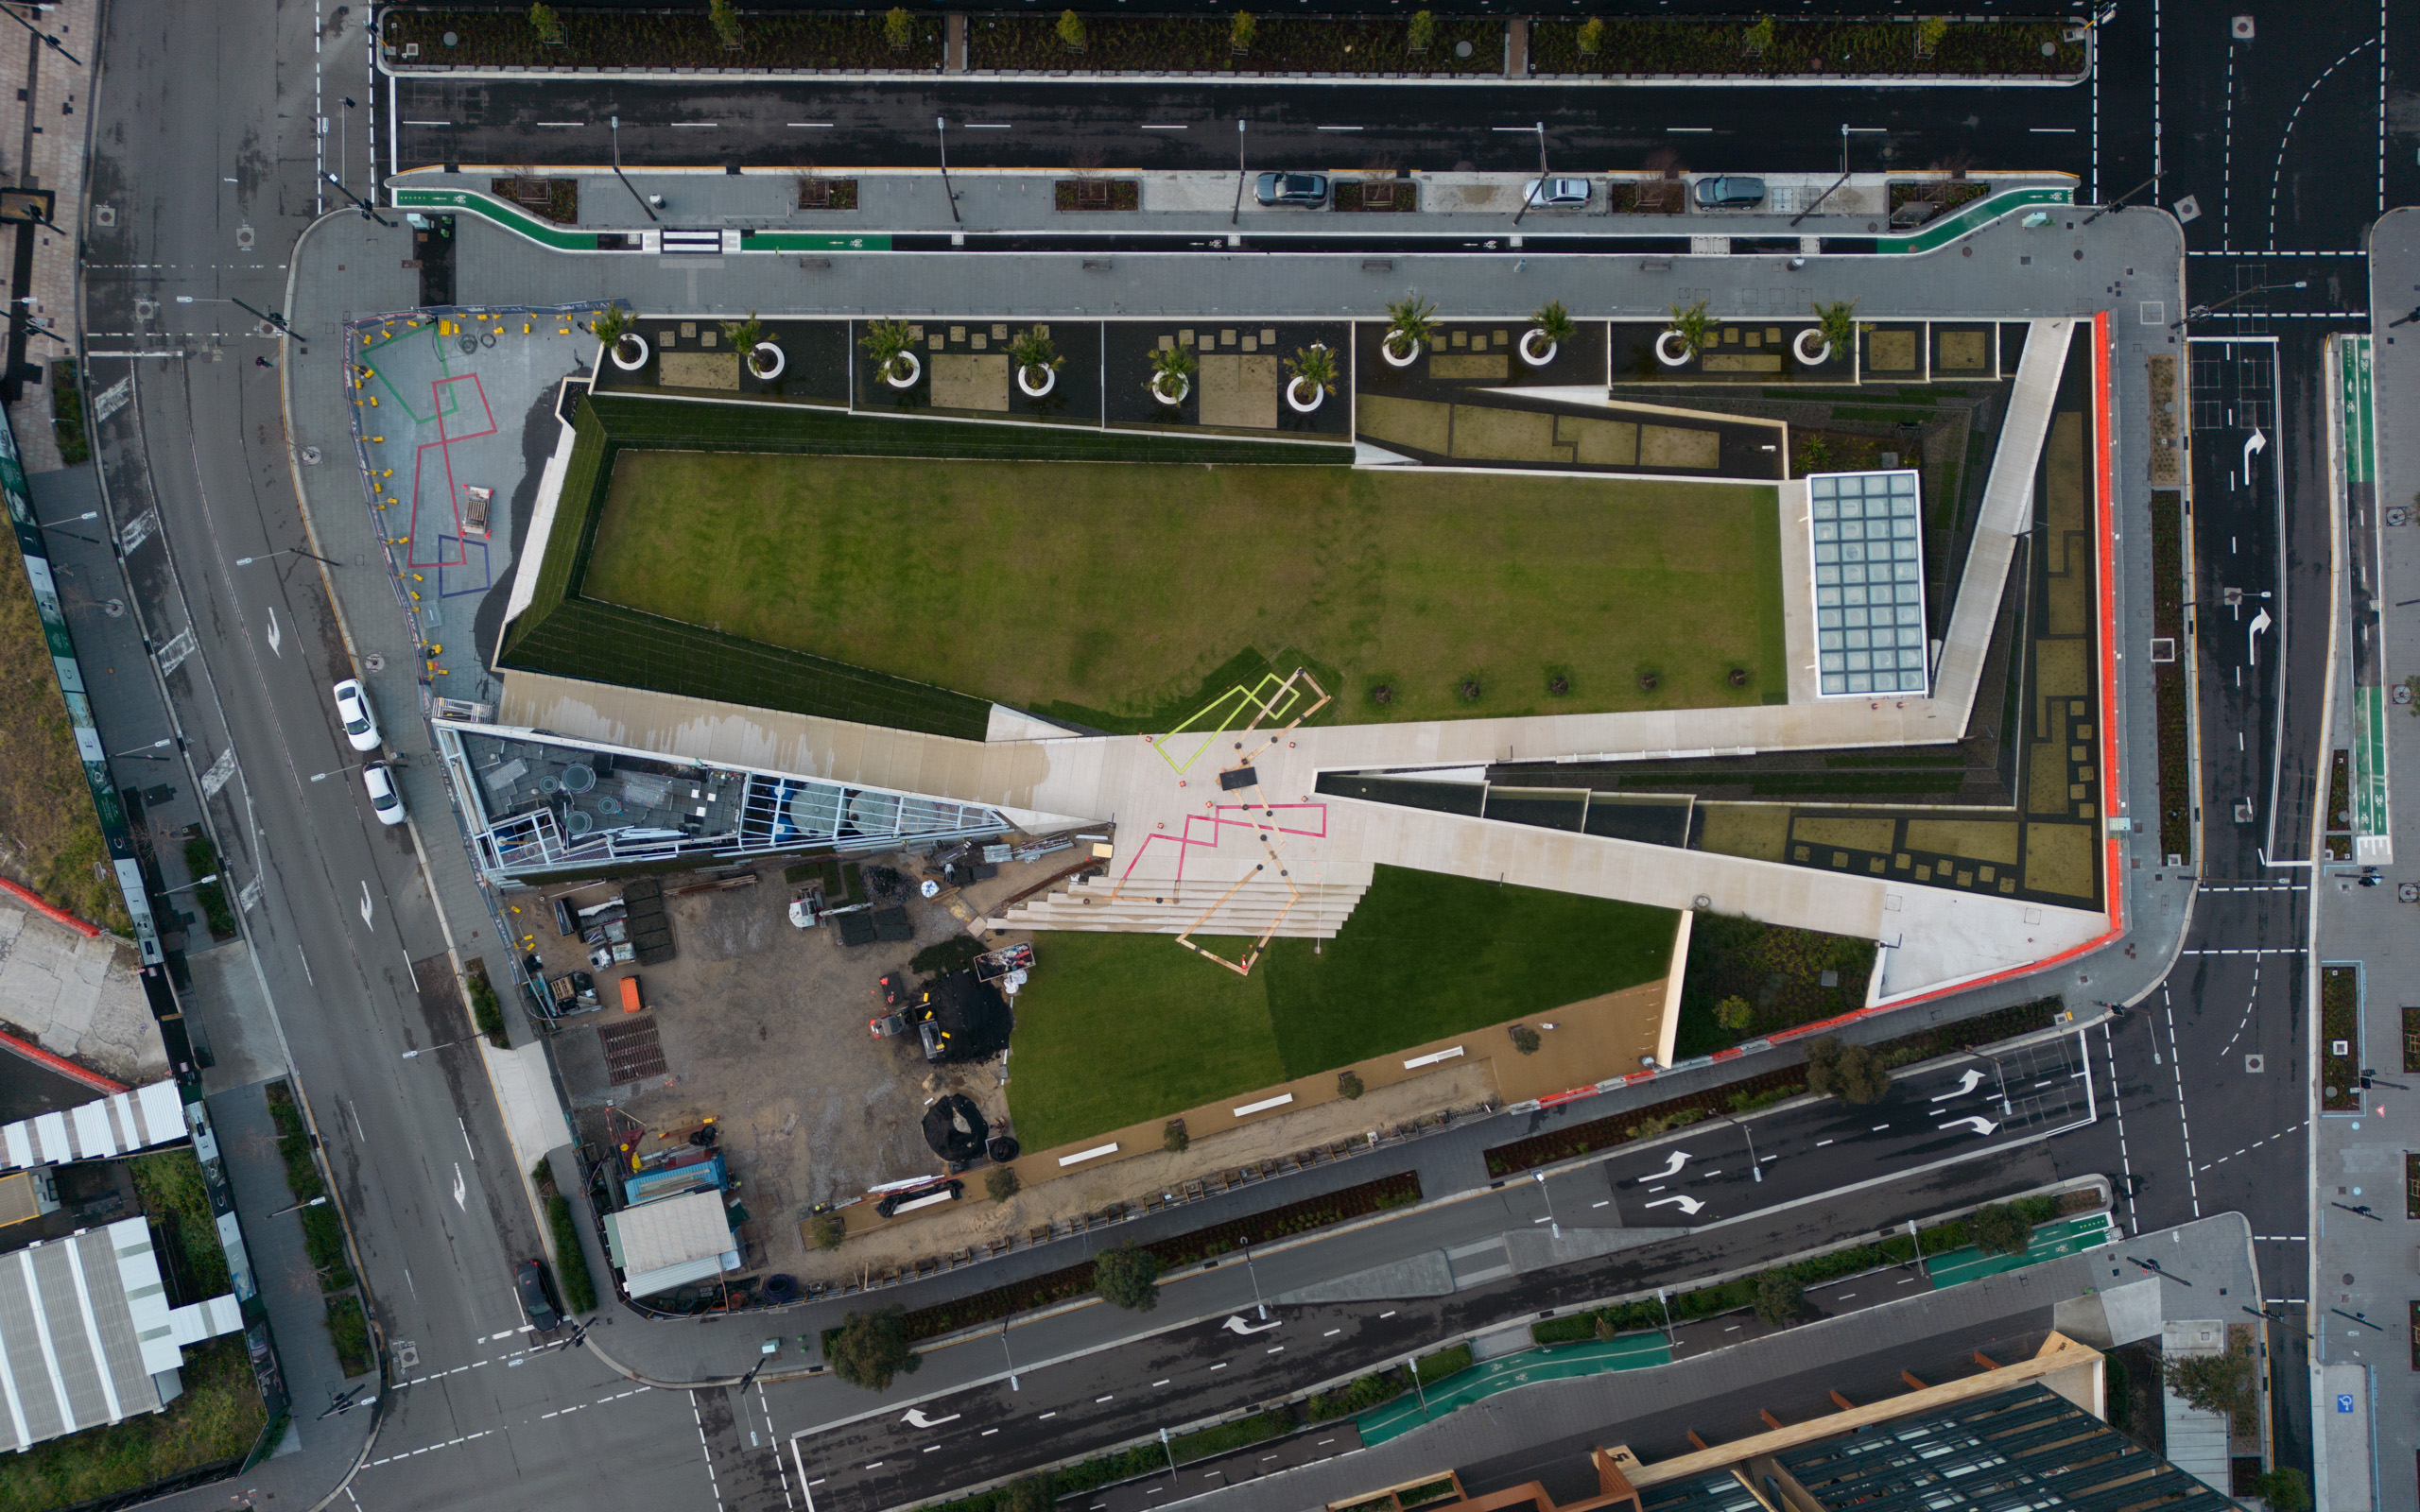
On Saturday the 15th of October, Clover Moore (Lord Mayor of the City of Sydney) opened The Drying Green, the new centerpiece park of Green Square. It’s been in construction since March 2018 and includes areas of grass, wetlands which filter stormwater before it enters the wider system, and a barbecue and seating area. It…
-
The Best Apps for Bicycle Directions
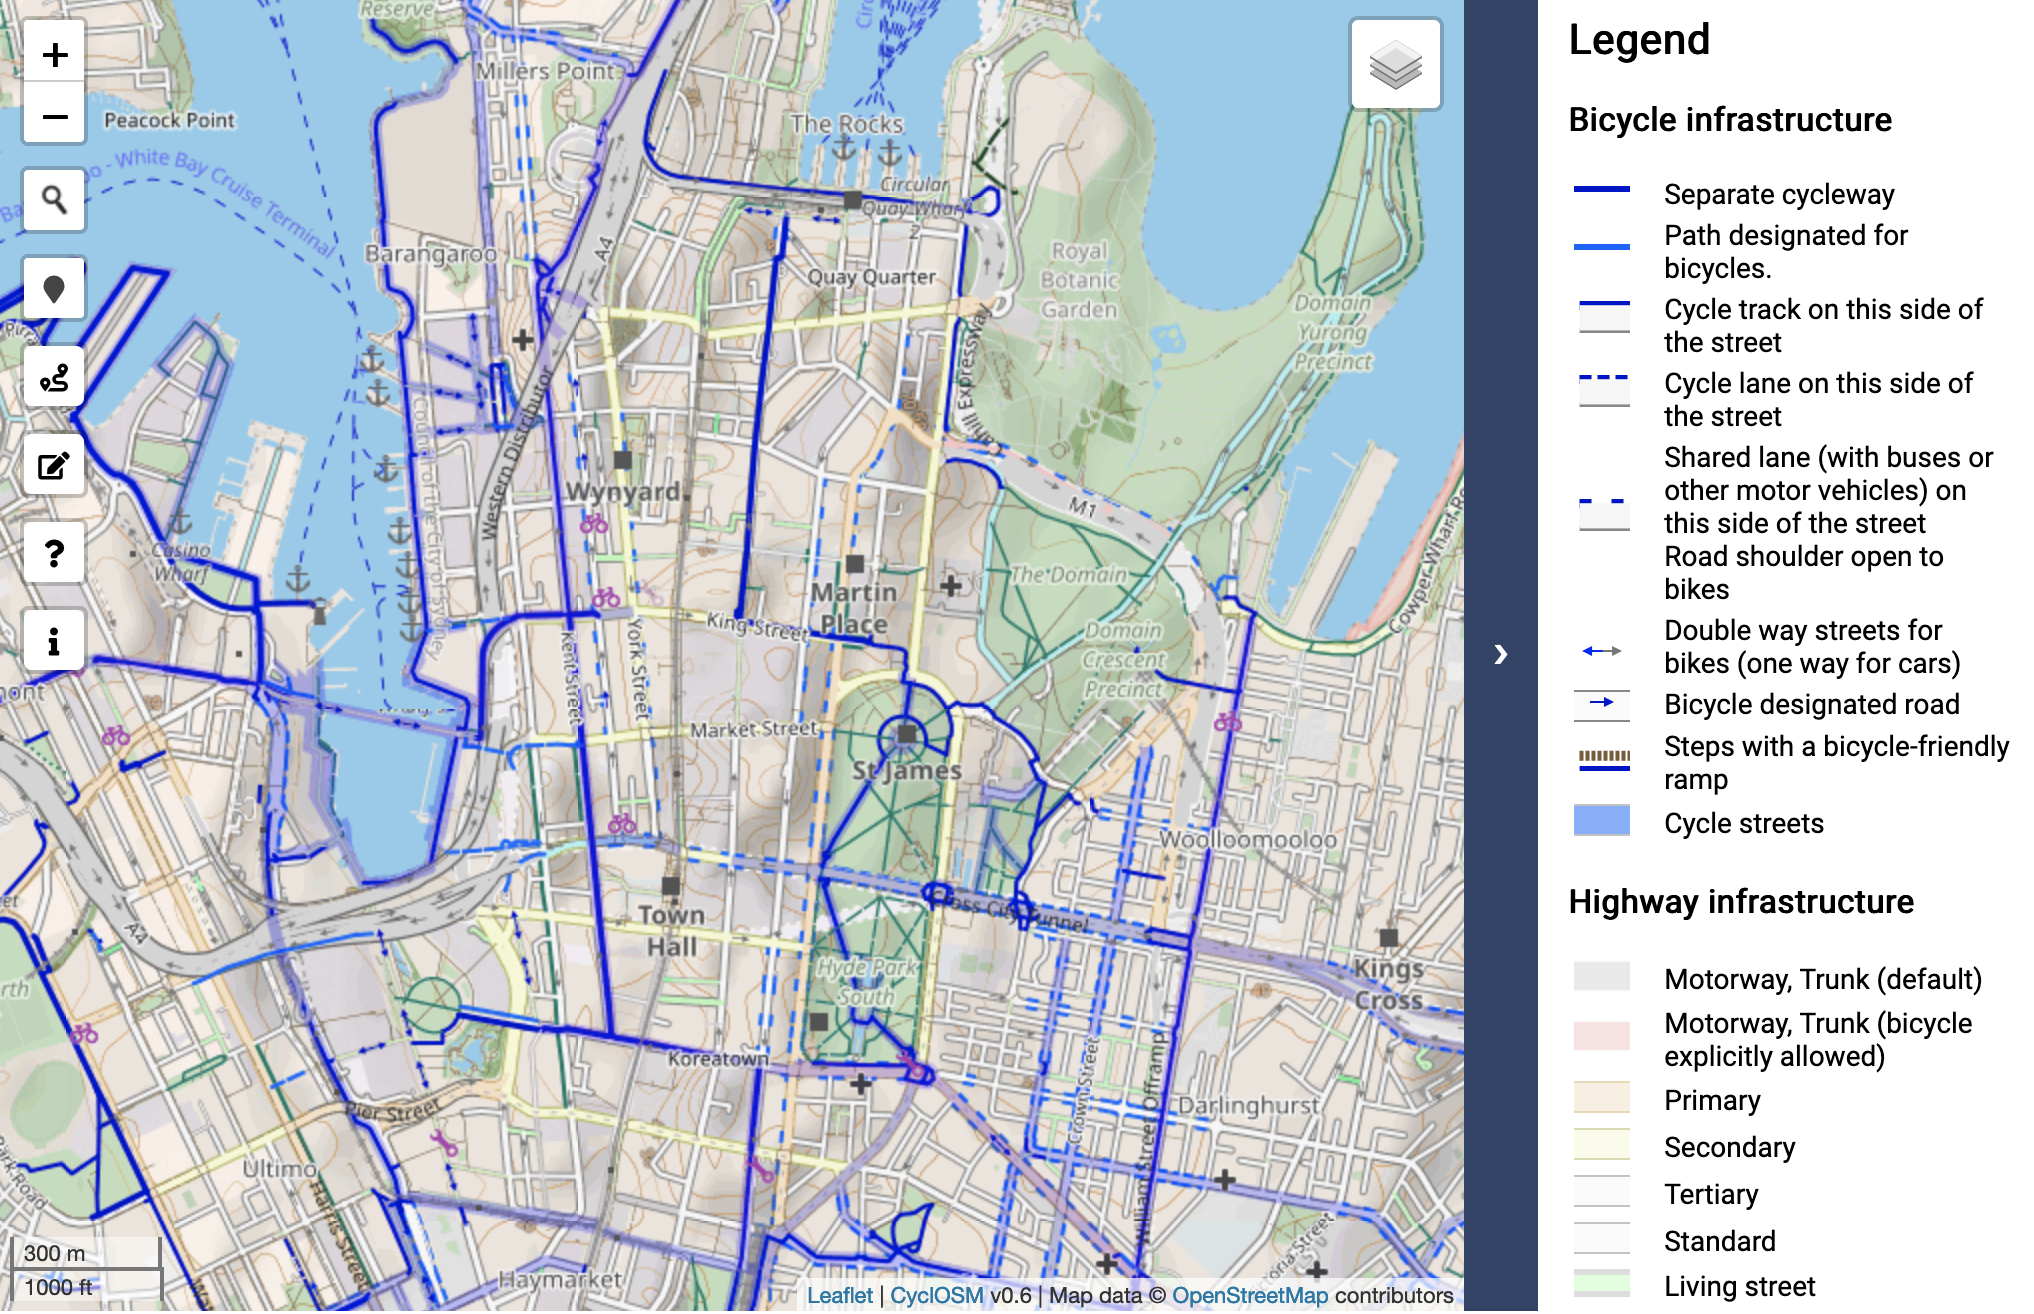
Even though some cities have dedicated bicycle infrastructure, it’s of no use if you don’t know where it is. While Google Maps is excellent for car navigation (and the dominant market leader), it often has patchy cycle infrastructure coverage and tends to generate cycle routes on busy roads. The best dataset of cycle infrastructure worldwide…