See comments below, on Mastodon, LinkedIn, or Reddit (r/australia). See further coverage of Better Intersections on ABC News (Reddit, LinkedIn), which has also been linked from the Sydney Morning Herald (Archive url). Consider this article evergreen – since the time of publishing (July 2023) I have updated it as I have learned more. Last edit made 2025-08-31.
This blog post provides an overview of traffic signal operation in Sydney (focusing on the inner city), based on technical documentation, conversations with government & industry experts and data I’ve collected after building Better Intersections.
Traffic signals are quite literally at the intersection of our urban spaces and transport policy. They have a huge impact on city life, pedestrian safety, and the uptake of active transport like walking and cycling. Through the brilliant Movement & Place framework, Transport for NSW has a stated goal of increasing walking and cycling trips and reducing pedestrian wait times at intersections.
Currently there is no open data on traffic light timing programming or timing in Sydney or NSW. Timing programming in a proprietary format can be purchased for AU$200 per intersection with a restrictive license that does not guarantee advocacy organisations would not be faced with legal action. Meanwhile, WA Main Roads publishes monthly exports of past actual cycle time phases in GeoParquet format, and Victoria publishes all their operational sheets under an open CC BY 4.0 license, including > ~10 PDF pages (or HTML sheets) of documentation per intersection (but still don’t include nominal cycle time).
I hope this article demonstrates why signal data should be as public as a train network timetable – and subject to the same public scrutiny and debate as one (even though complex trade-offs are involved). It’s long and dry, but should be a helpful resource for others looking to write more detailed or opinionated analyses.
Note: I am not a trained traffic engineer; my background is computer science and I work as a software engineer. This analysis is a side project. Please let me know of any mistakes, corrections or improvements in the comments below (or privately to [email protected]) and I will update if incorrect.
Table of contents
- Maps
- Traffic light cycle times
- How long do pedestrians get to cross the road?
- When and why are cars allowed to cross when people are still walking?
- Automated pedestrian traffic signals / automatic introduction
- Pedestrian priority signals / cars requesting to cross the road
- Isolated signals
- What sort of "green waves" are used?
- The complaint process for pedestrian signal timing discourages feedback
- Why do traffic signals take so long to implement / redesign?
- The extremely high cost of purchasing SCATS timing data
- SCATS upgrade
- Do buses get signal priority? Which routes and when?
- Future signal development
- Additional notes
- That's all folks!
- Further reading
Maps
Automated pedestrian signals
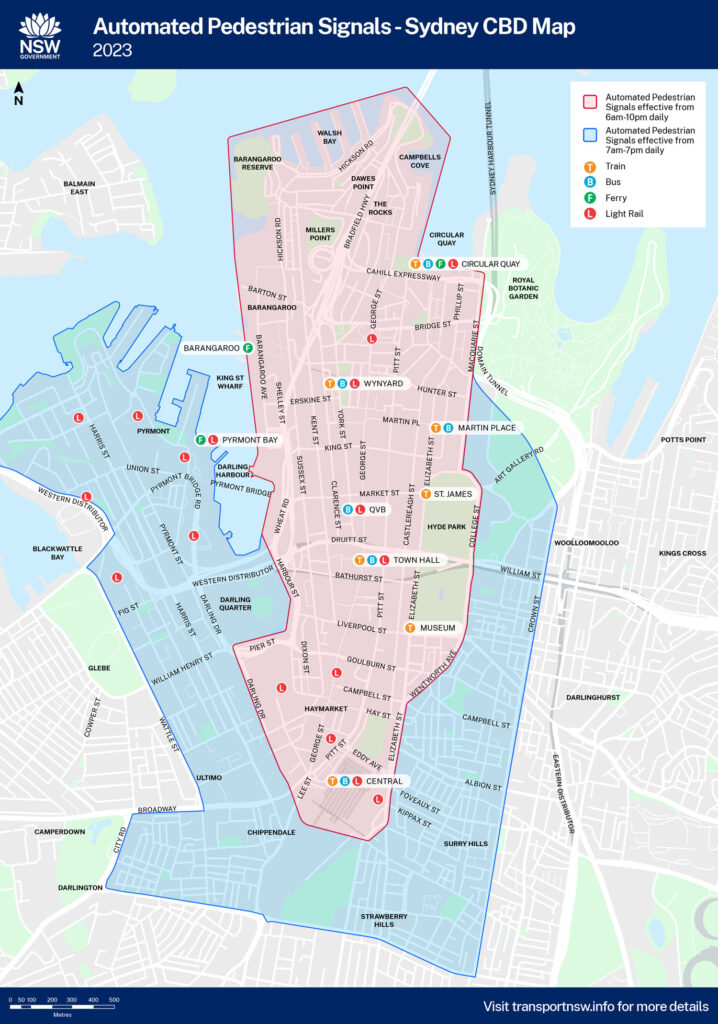
Above: Map of automated pedestrian signals in Sydney’s CBD, ref GS22402_V006_17JAN23 (Source: TfNSW, supplied. Published with permission.)
In the blue area some major roads (state roads) have the automatic pedestrian signal feature disabled. These exact locations are publicly unknown.
Earlier automatic signal maps are published as:
- GS22402_V004_15DEC22: https://transportnsw.info/document/6231/gs_2402_automated_pedestrian_crossings_map_v004_15dec22.pdf
- SCO_0573 / 002/ 23MAR20: https://transportnsw.info/document/4897/sydney-cbd-pyrmont-pedestrian-access-automation-map_23mar20.pdf
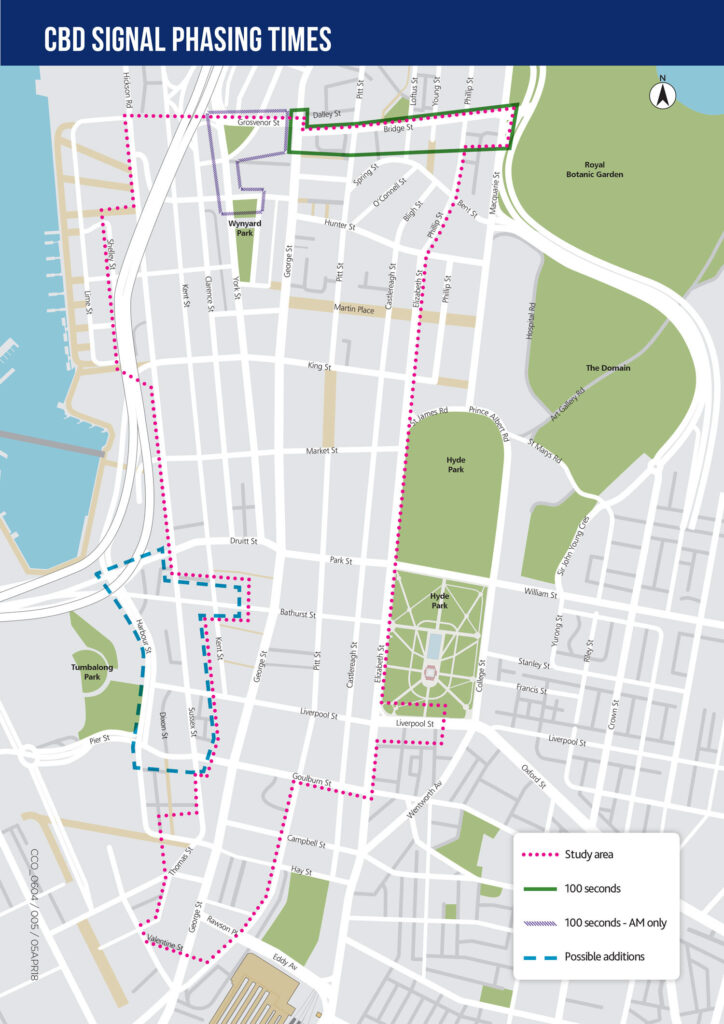
Above: Map of CBD signal phasing times, 2018 (Source: TfNSW, supplied. Published with permission). Filename CCO_0604_SYDNEY CBD BRIDGE ST TO GOULBURN ST PED EVAL MAP_05APR18_V005.
This map has not previously been publicly available. The above map shows the state of the city in April 2018. The “Study area” border is still a broadly accurate border of the 90 seconds cycle area, with minor changes at the edges (also not publicly available). A number of years ago (I don’t know exactly when) the cycle time was 120 seconds, which had been reduced to 110 seconds.
Some of these intersections (10 or 15) sometimes runs 45 seconds in off peaks. These appear to be intersections with more people, but there is no guidance on how these were selected.
- Map of traffic signals with countdown timers in OpenStreetMap (needs some work, let me know if you know of others): https://overpass-turbo.eu/s/1wVx
- Map of scramble crossings in OpenStreetMap (needs some work, let me know if you know of others) https://overpass-turbo.eu/s/1wAk
Traffic light cycle times
Why do traffic light cycle times matter?
Walking and cycling are more attractive when you don’t have to wait for minutes at a traffic light. When pedestrians have to wait more than 30 seconds they are more likely to cross on a red light. (Martin, A., 2006. Factors influencing pedestrian safety: a literature review (No. PPR241). Wokingham, Berks: TRL (Transport for London). Longer light cycle times increase car throughput and increase vehicle speeds at the expense of pedestrian & cyclist amenity.
Sydney is an important study location as it is the birthplace and development location of the Sydney Coordinated Adaptive Traffic System (abbreviated SCATS). This traffic management system includes an algorithm that optimises traffic throughput at signals, but it can only measure vehicle volume on the road. I have been told it has been used in Shanghai to measure bicycle volumes to calculate phase times for cyclists, but am unable to verify this.
SCATS does not count people on the footpath, and the crossing phase is only “called” by either a push button or by being automated. It currently does not support a non-binary pedestrian presence – innovative solutions like LiDAR or computer vision need to count pedestrians and then activate a (boolean) sensor value. It is unclear whether in-progress upgrades to SCATS will provide any functionality to measure or prioritise pedestrians and cyclists. Press releases mention prioritisation but previous work to add more interfaces to SCATS has not been widely released (see Future Signal Development section).
The NSW Government sells the system commercially to 30 countries and 200 cities around the world by the NSW Government. We are quite literally exporting our biases (in technical respects like limited pedestrian counting functionality – maximum cycle time and other choices are made by the local operator).
The Transport for NSW (TfNSW) technical guide, “Traffic Signal Design Guide: Section 7 Phasing and Signal Group Display Sequence” (2016) states one of the design objectives of choice of phasing should be to minimise the cycle time (pg 5).
Sydney lags behind best practice signal timing compared to London, Copenhagen and the USA
The Sydney CBD has a 90 second SCATS maximum cycle time which is generally considered short by Australian standards. The CBD cycle time was reduced from 110 seconds to 90 seconds on the 7th of January 2018 (CoS motion 2018-08-17). This achievement was noted in the 2020 report by Gehl Architects 2020:
The reduction in waiting times has improved pedestrian amenity, however further improvements can be made.
“Public Space & Public Life Study 2020” Gehl Architects, page 142
…
Transport NSW have reduced pedestrian signal cycle time from 110 seconds to 90 seconds enabling more frequent crossing opportunities for pedestrians.
Further changes will be explored after light rail becomes operational to ascertain further efficiencies.
TfNSW & the RMS undertook monitoring for a three month period to assess impacts across the network (“Look up: Keeping pedestrians safe, June 2019, NRMA, PDF page 8, in turn referencing “Transport for NSW (2019). Personal correspondence.”) It was reduced from 120 seconds to 110 seconds a few years prior (I do not know when).
Copenhagen has a 70 second cycle time as the maximum, and high pedestrian usage areas have cycles of 48-60 seconds. Gehl Architect’s state “Jaywalking is not a common phenomena in Copenhagen as traffic lights accommodate for reasonable waiting times for pedestrians” (Gehl Architects, Public spaces & public life: Sydney 2007 (part 1), page 142).
The London Cycling Design Standards states “junctions with pedestrian crossing facilities, signal cycle times should only exceptionally* be longer than 90 seconds.” *(emphasis mine).
The 2018 transport for London walking action plan states:
TfL has responsibility for all London’s traffic signals, undertaking annual timing reviews at 1,200 signal junctions and crossings. In 2017, TfL reduced the wait times for people walking at 200 crossing locations close to schools, hospitals and transport hubs (see Figure 8). From 2018 onwards, this will be an objective for all signal timing reviews and, for the first time, ‘pedestrian time saved’ will be measured alongside other performance metrics.
Of the 200 reviewed crossings to date, 94 per cent now run a cycle time of less than one minute, meaning that if a person walking was to arrive just as the red signal for pedestrians came on and traffic was given a green light, they would only wait around 40 seconds or less to cross.
Chapter 6 – Building and managing streets, “Walking action plan – Making London the world’s most walkable city”, Transport for London, July 2018 (PDF page 29)
The Urban Street Design Guide by the (USA) National Association of City Transportation Officials recommends cycle times of 60-90 seconds in urban areas.
See traffic signal cycle times around the world on Better Intersections, and see graphs and charts at betterintersections.jakecoppinger.com/analysis.
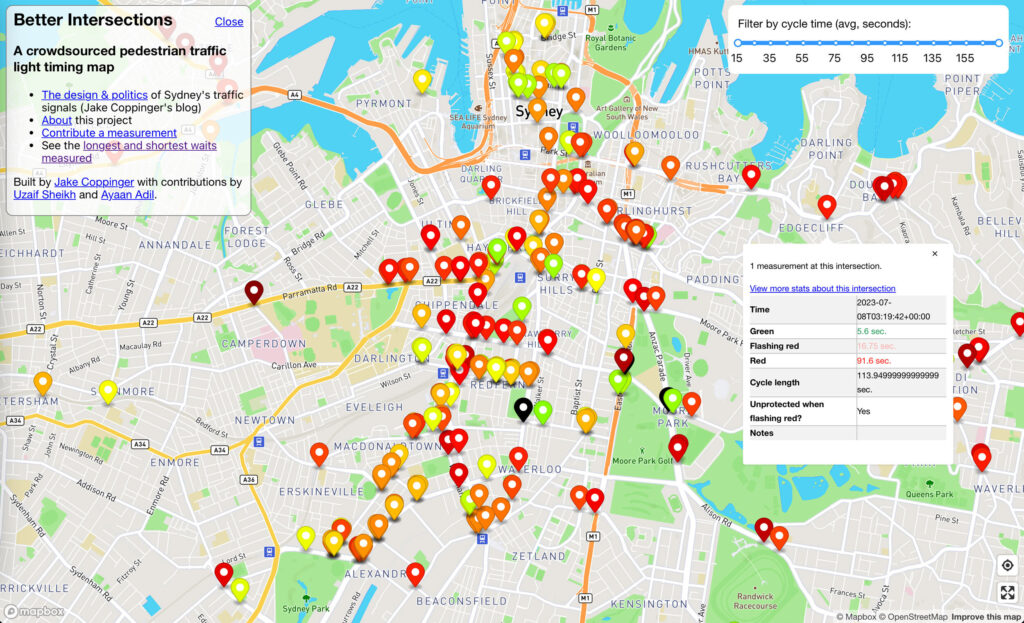
Open source data collected with Better Intersections
I previously wrote a blog post on a website I built to crowd-source the collection of pedestrian traffic light timings: https://jakecoppinger.com/2023/06/mapping-pedestrian-traffic-light-timing-in-sydney-australia/
The data is licensed ODbL (for you, OpenStreetMap contributors!) and the website is open source too.
It has collected over 800 data points, each with measurements on green duration, flashing red duration, solid red duration, and notes such as whether the crossing is protected or has a countdown timer. Community groups including WalkSydney have expressed interest in involving their members in sourcing measurements.
Max Bo, a software engineer at Canva, has also begun some preliminary analysis of the data using the informational visualisation platform Observable: https://observablehq.com/@mjbo/better-intersections-sydney-traffic-light-timings
Who sets signal cycle times in Sydney?
In NSW the state transport department (TfNSW) builds, maintains, programs and operates all traffic signals. This is the case even on local roads (90% of all roads), where the local council is the authority.
TfNSW Operations has the very challenging task of designing and operating the timing of the network, with many stakeholders and a steady flow of complaints.
At present I understand that there is not a perceived need for the data to be published, however it is not considered to be confidential (see the below section TfNSW reasoning against release of signal timing data in NSW). On the contrary I would like to note the extremely restrictive license conditions upon purchase of traffic data detailed below. From what I can understand, one of the main reasons why the data has not been freely published is that the data export is a manual process. However, no data on minimum or maximum green times is published in NSW, though Victoria (who also use SCATS for their traffic lights) publishes all their operational sheets under an open CC BY 4.0 license.
Many transport advocacy groups, such as WalkSydney and BicycleNSW have attempted to source this data for a number of years for advocacy purposes to further understand how to better support vulnerable road users, but to date have not gained access. The restrictive license on data sourced from the TfNSW Traffic Signal Portal does not make it clear if any use of the data for advocacy purposes would result in legal action by the state.
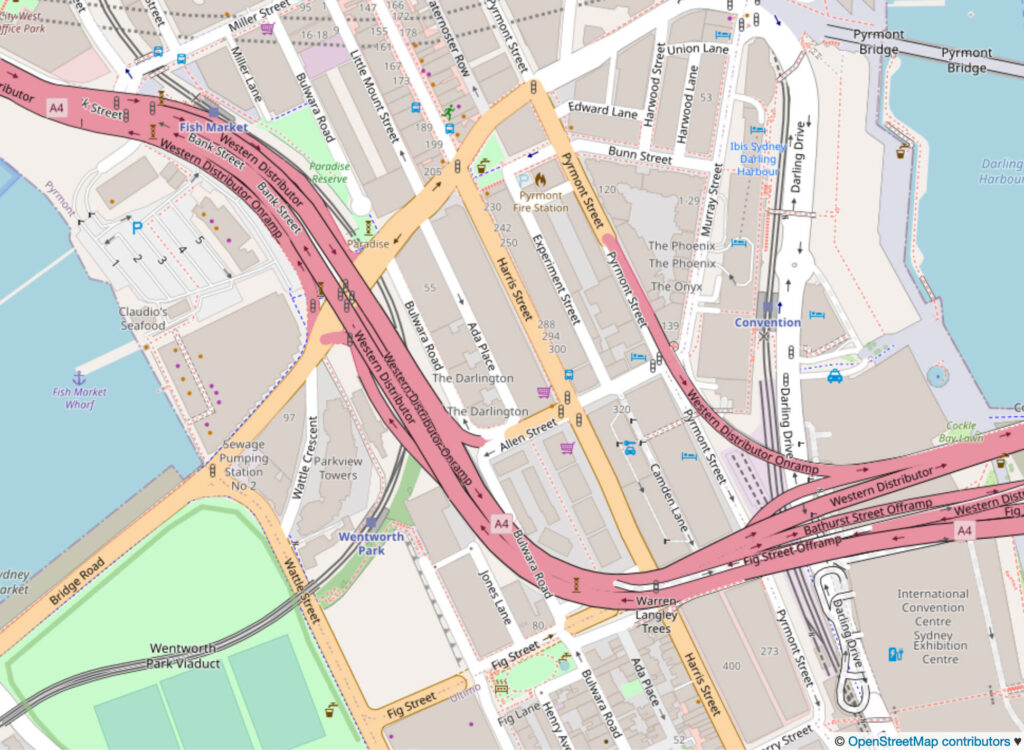
In the City of Sydney (the CBD) the TfNSW operations team will know in little time if gridlock occurs, either from stakeholders or an extensive network of remotely controlled pan/tilt traffic video cameras (though they’re likely too busy to be watching such feeds unless an issue presents). They have to manage the traffic volume entering the CBD grid from motorway off ramps to prevent the queuing of cars on motorways.
Whilst many cities are demolishing their urban motorways, the recent WestConnex urban motorway project was recently constructed under a public-private partnership between the NSW State Government and Transurban. Transurban is a publicly listed company that after considerable privatisation, has majority ownership of 95 of the 99 kilometres of Sydney’s toll roads.
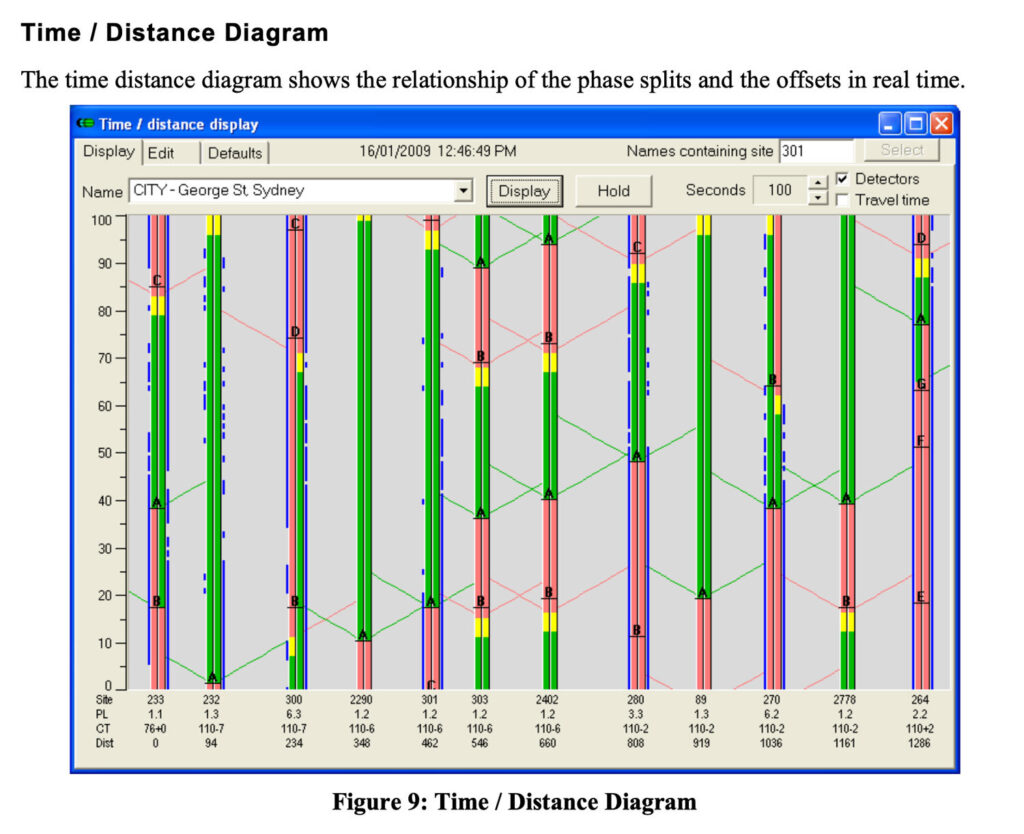
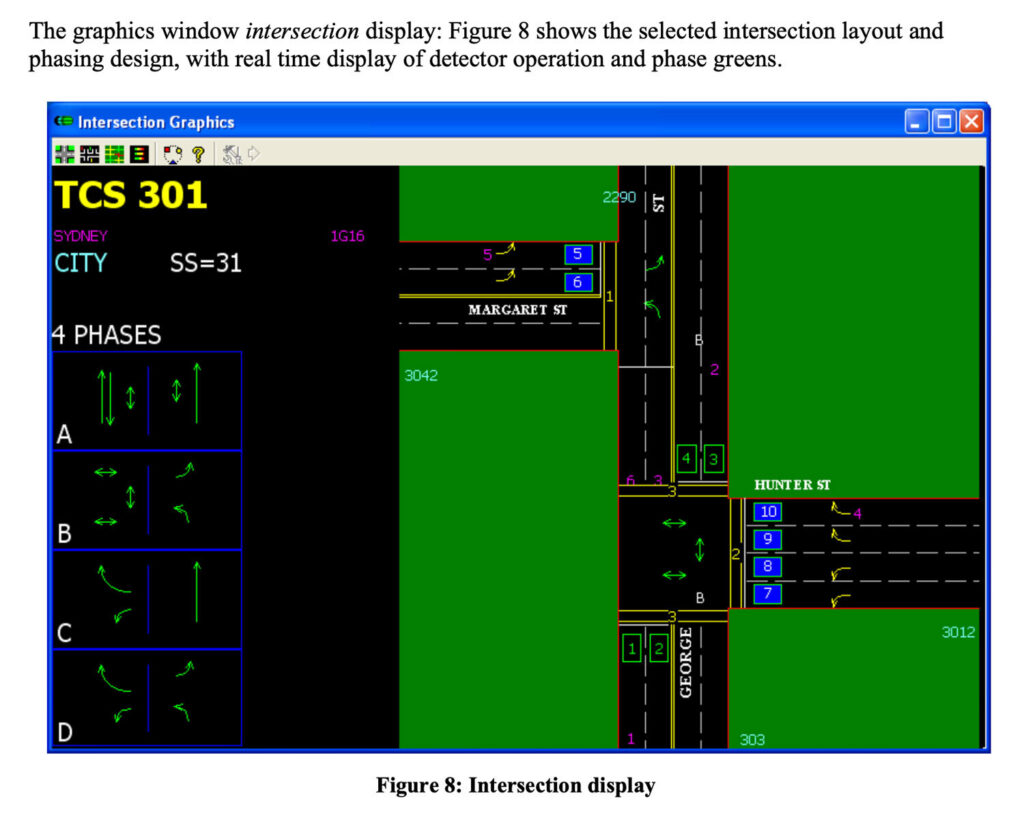
A given intersection will have a number of phases programmed into SCATS. A phase is a particular movement at an intersection (such as cars green in one direction and red for the other direction).

Note the phases on the left hand side of the SCATS software.
For a deep dive on the SCATS software, see “The New Generation SCATS 6”: https://www.aldridgetrafficcontrollers.com.au/ArticleDocuments/230/Introduction_To_New_Generation_Scats_6_5.pdf.aspx
TfNSW does not currently have a policy on cycle times
Transport for NSW’s Traffic Signal Operation document does not provide specific guidelines on cycle times and only focuses on safety critical timings. This means they do not currently have public guidelines for traffic signal cycle times.
However, “method 3”, page 7 of the Technical Direction on Traffic Modelling (https://roads-waterways.transport.nsw.gov.au/trafficinformation/downloads/ttd_2018-002.pdf) states
Method 3 (for new signals)
https://roads-waterways.transport.nsw.gov.au/trafficinformation/downloads/ttd_2018-002.pdf
Assume a typical phase configuration and a cycle time of 140 sec (longer or shorter than 140 sec times may be used when accepted by RMS) and calculate phase times using traffic signals software such as SIDRA, LinSig, TRANSYT, etc. Then set initial maximum green times of all phases in the same way as in Method 1.
This appears to be a statement of an internal policy, but note the words “unless accepted by RMS” (the predecessor to TfNSW).
The TfNSW Road User Space Allocation Policy provides strategic advice but does not provide any guidelines for cycle times. It specifies the equitable allocation of of temporal and spatial space must consider walking first:
This policy sets out the mandatory principles and requirements Transport staff must follow when allocating physical and temporal road user space safely and equitably to support the movement of people and goods and place objectives. (emphasis mine)
Transport must allocate road user space based on the following principles:
…
– allocate road user space based on the network vision and road functions, considering all road users in order of:TfNSW RUSAP, page 2
- walking (including equitable access for people of all abilities)
- cycling (including legal micro-mobility devices)
- public transport
- freight and servicing
- point to point transport
- general traffic and on-street parking for private motorised vehicles.
Although there is no policy or commitment to lower cycle times and pedestrian waiting times, it is apparent the lower cycle times are situated in areas of high pedestrian activity.
Note that for coordination, a common cycle time must be used, so generally, intersections in a network or along an arterial road need to have the same minimum and maximum.
I have been told SCATS has a feature of multiple minimum cycle times which are chosen based on the degree of saturation (DS). Switching between such minimums can result in a large drop in cycle time relatively quickly.
How long do pedestrians get to cross the road?
Length of green light
The length of the green pedestrian signal at traffic lights is calculated by summing a minimum value, plus a constant amount predetermined by how many people will cross at the intersection (in theory).
The NSW standard is for a minimum 6 second green light, and then an extra 2 seconds for each additional rank (row of people) above 3. This presumes that 6 seconds is enough to clear 3 rows of people from the adjacent footpath.
This NSW operational theory falls down in the CBD when there are large volumes of people.
Although not formalised the operations team are constantly reviewing intersections in the CBD especially for pedestrians. Furthermore, for major projects such as Sydney Metro or Light Rail, modelling with Pedestrian Comfort Levels as per TfL standards or TfNSW Walking Space Guide is undertaken on nearby footpaths and intersections to ensure reasonable levels of service are maintained.
In general the length of time is set by manual observation (not real time CCTV or computer vision or anything), and is private. (see below section on SCATS data cost).
Information I’ve not been able to ascertain includes:
- how often measurements of the pedestrian volume are taken;
- what time of day they are taken;
- whether the min/max/avg/85th percentile is used;
- how often they are updated.
In Victoria, Volume 5: Intersection Modelling of the Transport Modelling Guidelines (2020) specifies:
At existing locations, where a revision to the intersection control is proposed, pedestrian crossing counts should be undertaken. These would usually be done as part of video surveys of peak periods (Section 6.6.1.1). This is particularly important where pedestrians will be provided with priority over vehicular traffic as it can have a significant impact on capacity e.g. left hand turn movements. The presence of high numbers of pedestrians may also influence the form of intersection control on safety and amenity grounds. The data collection may involve more than just an aggregate number of people at a site but might identify how pedestrians impact the movement of traffic.
(emphasis mine)
The Victoria Department of Transport even release their manual count data from detector and survey locations, though the link appears to currently be broken.
The Department of Transport have a repository of manual count data from detector and survey locations. For further information and project specific request visit the following link: https://www.vicroads.vic.gov.au/traffic-and-road-use/road-network-and-performance/road-use-and-performance
When there is no need to make the pedestrian light red (that is, there are no cars to implicitly prioritise and move across the intersection), the pedestrian green light will stay on for as long as possible until the end of the non-conflicting phase (subtracting the time for the flashing red of course).
The green walk period can be extended at schools during school hours, either by time-of-day routine (Personal correspondance, 2025-03). I am unsure of how such locations are specified or how much extension is provided.
SCATS has three methods of controlling the length of the green walk signal:
- terminate “x” seconds from the start of the phase
- terminate “x” seconds from the end of the phase
- walk for green – stay green for as long as possible regardless of phase length
In all cases, the green signal for pedestrians is never be displayed for less than the minimum time as defined in the times setting saved inside the traffic signal controller.
Length of flashing red light
The length of the flashing red light is determined by the road width. People are assumed to walk at 1.2 metres per second (an 85% percentile figure, so about 15% of people walk slower than this), so the road width divided by this figure is used to determine the minimum flashing red time.
When and why are cars allowed to cross when people are still walking?
The flashing red light is legally defined so that pedestrians may not step off the kerb, but may finish their crossing.
Generally cars are allowed to have a green light when a flashing red light exists for pedestrians, and they are meant to yield to pedestrians.
Vehicles turning left or right who enter an intersection on a green roundel must give way to pedestrians on parallel crossings when either the Green man or flashing red man is displayed.
TfNSW is undertaking a safety program to add red arrows to prevent “green-on-green” occurrences – when pedestrians and cars have a green traffic light which is in conflict.
It is being rolled out at two-phase signalised intersections across NSW, and is being expanded to cover all traffic signals. The modification is mandated whenever major works are undertaken outside the program.
While this program undeniably improves pedestrian safety and is a positive change, it is unclear whether reducing vehicle speeds would be a more cost effective use of taxpayer money than retrofitting thousands of traffic signals in NSW (or could be pursued in addition). I consider this outside the scope of this blog post.
Automated pedestrian traffic signals / automatic introduction
Automated pedestrian traffic signals don’t require a pedestrian to press a button to request to cross the road.
When the pedestrian phase is automated:
- The button does nothing when pressed (placebo)
- The pedestrian phase is never skipped – every SCATS traffic light cycle includes the pedestrian phase
Non-automated pedestrian signals may skip the pedestrian phase if the button is not pressed.
There is no such functionality where holding in a PB/5 pedestrian button extends the green light for pedestrians.
Pressing the request button before the car phase goes red should guarantee the green man for pedestrians (prevent skipping the green pedestrian phase), however this varies depending on the age and model of the controller. I’ve not come across any public information on differences between controllers on this behaviour in my readings thus far.
The actual pedestrian-experienced duration between when you push the button and you can actually cross is a mystery – not public knowledge, and I have not yet implemented the ability to measure this with Better Intersections (PRs welcome!).
Automated pedestrian introduction at traffic signals has existed in some areas in the Sydney CBD since the late 1970s or early 80s.
For certain time periods during the day they are also operating in Parramatta, Redfern, Chatswood, Liverpool, North Sydney, Newtown, St Peters, and numerous isolated intersections (outside of these times pedestrians are still required to press the push button).
To my knowledge there are no publicly available maps of the automated pedestrian signal area until COVID, even though automation has existed since the mid 90s.
Pedestrian crossings during COVID outbreaks
I wrote an article about the situation during the initial COVID outbreaks:
Sydney CBD is bringing back pedestrian “beg buttons” (December 2022).
In summary, more pedestrian signals were automated and covers were placed over the buttons so there was less physical contact.
The locations of all newly automated pedestrian signals programmed during the initial COVID outbreaks was not public, however a 2020 media release mentioned 11 health precincts (TfNSW Media Release, 28/3/2020).
Removal of automated pedestrian crossings after COVID outbreaks
After initial COVID outbreaks:
- the plastic button covers were removed
- a publicly unknown number of crossings at not publicly locations were reverted to non-automatic operation permanently
- the automated crossings that remain are only automated for daylight hours (hours for the CBD is known)
Buttons in the CBD are affixed with an adhesive plastic label explaining the hours of automation which is already coming off in many places.
On Friday the 16th of December, Transport for NSW announced:
From mid-December 2022 Transport for NSW is removing the push button hard covers but maintaining the automation of pedestrian crossings at traffic signals during daytime hours. This is to reduce overnight noise for local residents and allow for more efficient intersection operation for all users when activity is low.
The overnight noise mentioned – the stated reason for removal – was due to many complaints from residents living near signals, where the frequent green pedestrian walk sound disturbed sleep.
I do not know, and it is publicly unknown how many complaints were received. I also do not know why the changes were applied to area where there are few ground floor residents (eg. many streets in the city centre).
It was not uncommon for signals to allow a green phase every cycle (often a 24-36 second cycle due to low traffic volumes). The areas impacted by overnight noise are not publicly known – likely in dense residential areas where homes are very close to traffic signals.
However, the “green walk” sound of the pedestrian signals can be muted. SCATS supports this functionality and the National Cooperative Highway Research Program study “Accessible Pedestrian Signals: A Guide to Best Practices” (https://www.trb.org/Publications/Blurbs/164696.aspx, DOI: 10.17226/22902), summarised at http://www.apsguide.org/chapter10_australia.cfm states:
APS [Accessible Pedestrian Signals] are sometimes turned off at night due to neighbors’ complaints about noise.
NSW has no crossings where the audio feature is muted. To my understanding the NCHRP guidelines were overridden disallowing selective overnight muting of individual problematic traffic signals in NSW on safety grounds. I do not have context for why this was the case.
Muting of audible traffic signals in Brisbane
There is a 2014 article about Brisbane turning off audible traffic signals for the entire CBD between 9:30pm and 6:30am, with very real impacts on people with a visual impairment.
The current content of the Brisbane City Council website suggests a more case-by-case basis approach to muting traffic signals, however I have not found any recent updates on the current state.
Automatic introduction of pedestrians signals in Melbourne
In Melbourne, automatic introduction currently applies from 5:30 am to 12:30 am every day. This is two hours more each day than in Sydney and there are more people living in the centre of Melbourne.
The automated phases matches the times that tram services are operating.
Automated phases also operate 24/7 crossings of the narrow ‘Little’ streets (where pedestrian lanterns exist) and at the intersections along King St (Flinders Lane to Latrobe St) and along Collins St (Queen St to Exhibition St).”
(Review of Signal Operations for Pedestrians in the City of Melbourne, David Nash, 2014)
Pedestrian priority signals / cars requesting to cross the road
In Sydney there are very few places where cars have to request to cross the intersection, rather than pedestrians and cyclists.
Some of this rare locations are:
- Most of Martin Place
- Carrington St (the eastern bus stops outside Wynyard Station)
- Harbour St near Hay St, Chinatown (multi lane road) – just north of the zebra crossing near the QMS advertising panel
- Somewhere in Chatswood, likely near the station
These locations are where there is very low car volume and high pedestrian volume.
Where they exist a zebra crossing would likely be more optimal, however in NSW zebra crossings are not permitted on roads with more than one lane in each direction for safety reasons.
There are none outside the CBD – although there are many locations where the volume of people could justify this type of intervention (eg: near railway stations, shopping streets or along beach fronts)
Research
Transport for London (TfL) trialled pedestrian priority signals at 18 locations in May 2021, and has published new data that giving priority to people walking, showing them a continuous green signal until a vehicle is detected approaching, resulted in:
Compliance with traffic signals by people walking increased by 13 per cent, reducing the risk of a collision with a vehicle, while compliance by people driving stayed the same. The data also shows that the signals had virtually no impact on traffic, with only minimal changes to journey times for buses and general traffic – the largest increase for buses was only 9 seconds and for general traffic only 11 seconds. Several sites showed improvements in journey times.
New TfL data shows success of innovative ‘pedestrian priority’ traffic signals, 24 February 2022, TfL
Isolated signals
Signals may also operate in Isolated mode, with local vehicle actuation (by detector loops) being the sole operating strategy. In Isolated mode the sequence and the maximum duration of each phase is as specified in the local controller time settings. The local controller may terminate any phase under the control of the local vehicle actuation timers or skip an undemanded phase, unless prohibited by the local controller settings. Isolated mode may be specified as the fallback mode of operation.
The New Generation SCATS 6
This results in faster start to the green pedestrian phase when a button is pressed
SCATS can set any intersection to isolated mode at any time for any reason. It could be based on
- time of day
- day of week
- cycle length
- a low degree of saturation (measure of how much demand there is relative to the capacity)
The decision is up to the signal programming.
A type of isolated signal is known as “Master-Isolated”. These behave like an isolated intersection (where a pedestrian pressing the button may almost immediately get a green), however are under the control of Masterlink (under remote control of SCATS). This gives a pseudo-Isolated operation that’s managed by the SCATS cycle length and plan data. Where designed, it’s usually enabled when the cycle length drops below a pre-defined threshold.
Locations of isolated signals
- The mid-block crossing on Joynton Avenue outside the Gunyama Park Aquatic and Recreation Centre in Green Square
- The mid-block crossing on Chalmers Street (near Central station) outside the swimming pool
Let me know if you know of more!
What sort of “green waves” are used?
A green wave occurs when a series of traffic lights are coordinated to allow continuous traffic flow over several intersections in one main direction.
They are commonly implemented for peak hour vehicle traffic into and out of the city. Where possible, the operations team also attempts to provide a “reverse” green phase in the opposite direction. My understanding is that this is tricky and not always possible.
I’m not aware of a any examples in Sydney of a green wave for cyclists or pedestrian traffic, except in cases where electric bicycles can achieve a similar speed as road traffic for a car-focused green wave (eg. Bridge Rd in morning peak). Cycling southbound along the new Castlereagh Street cycleway can sometimes feel like a green wave, however this is because cyclists may catch the motor vehicle green wave.
When switching between directions of green wave, SCATS rotation can adjust cycle time 20-30% to switch link plans.
Green waves for cyclists in Melbourne
There is a green wave operational on Albert St bike lanes in east Melbourne. It runs 8:00-9:30am inbound and 4-6pm outbound. Few people know that it exists – there are limited public comms. There are no inbuilt progression LED lights built into the pavement due to budget constraints.
There is also a current trial on Rathdowne Street, Carlton, using fisheye cameras. I’m unsure if this is yet integrated with SCATS (and if so, whether it presents a virtual loop or some other integration method)
University of Melbourne is partnering with Cubic Transportation System to roll out a number of smart cameras that watch road users and could control traffic flow accordingly – in real time.
Seven fish-eye cameras will be installed over the next few months above intersections along Rathdowne Street in Carlton as part of the Australian Integrated Multimodal Ecosystem (AIMES), led by Melbourne University professor Majid Sarvi.
https://bicyclenetwork.com.au/newsroom/2020/07/16/melbourne-tests-traffic-controlling-smart-cameras/
On Canning St, the Princes and Johnston St signals are timed to give a good bicycle run in AM & PM peaks. However, it is set to ~23km/h which in practice might be too fast.
Green waves for cyclists in Copenhagen
Meanwhile, the City of Copenhagen established the first green wave for cyclists on Nørrebrogade in 2007, so bicycles travelling at 20kph did not encounter red lights. This system included LEDs embedded in the pavement to help cyclists keep the same pace.
As of 2014, Copenhagen was experimenting with “Green wave 2.0”, a detection system that keeps traffic lights green if there are 5 or more cycling citizens (roughly) cycling together.
The evaluation report on green waves on Nørrebrogade showed that “travel time decreased by 17 percent for a cyclist who cycled out of town at 20 kilometres per hour”. [6] (Centre For Public Impact, 2016).
The complaint process for pedestrian signal timing discourages feedback
Complaining about a long pedestrian wait time at a traffic signal is not an easy process. It takes 7 steps on https://www.nsw.gov.au/transport-for-nsw/contact-roads-waterways/online and it is not clear that this is the correct form for walking related feedback at all:
- Click report an issue -> roads -> management -> set location -> then explain issue.
Operators may sometimes state non-existent policy:
…
~5pm on the 28th of August 2024
the whole principle of pedestrian movements is they are a slave to vehicular traffic.
…
The reason we don’t hold the walk is that we don’t want people running to get the walk because then, quite often, they’re running looking at the signal rather than the traffic, and in some instances, they step off the footpath in front of an oncoming car. So it’s a design standard that’s adhered
…
After further correspondence this was corrected and a “walk for green” was implemented (York St and King Street). Walk for Green” means the green pedestrian light is displayed for only slightly less than the green roundel for vehicles.
Another successful “walk for green” implemented after a phone line complaint (which I have been informed of) is Regent Street at Lawson Street.
Why do traffic signals take so long to implement / redesign?
A consistent thread I have seen mentioned in this space is that the issue of the implementation of new signals or signal redesign is often longest part of any road redesign or cycleway implementation project, often requiring upwards of two years.
I have limited detail on why this is the case, however some contributing reasons may be:
- Design of traffic signals being safety critical, requiring 4 engineers signing off on documents and detailed infrastructure diagrams
- Team busy working on adding red turning filter lights (and associated design) throughout the state along with countdown timers
I received a suggestion that another contributing factor could be loss of experience and expertise as traffic engineers reach retirement age. The sender noted he had worked in DMR/RTA/RMS/TfNSW for over 50 years, and that they knew many others in Australia that have been in traffic nearly as long.
The extremely high cost of purchasing SCATS timing data
Victoria publishes all their operational sheets under a a free and open CC BY 4.0 license, including > ~10 PDF pages (or HTML sheets) of documentation per intersection. This data contains minimum and maximum green times, but doesn’t appear to specify nominal cycle times. In Sydney or NSW, you must pay at least $200 to purchase the programming of a traffic signal for a single intersection under a very restrictive license.
The walk timings (along with target cycle and phase timings) appear to be stored in a plaintext format known as LX, which I’m not currently aware of any open source way to process except https://github.com/johntrieu91/scatsutilities (Python, MIT license).
An incomplete specification of the LX format is detailed at Attachment A (pg 15) of “Traffic Signals in Microsimulation Modelling”, a Technical Direction document by TfNSW. Further documentation is on page 48 of the Signal Data Information for Modelling report (Main Roads WA).
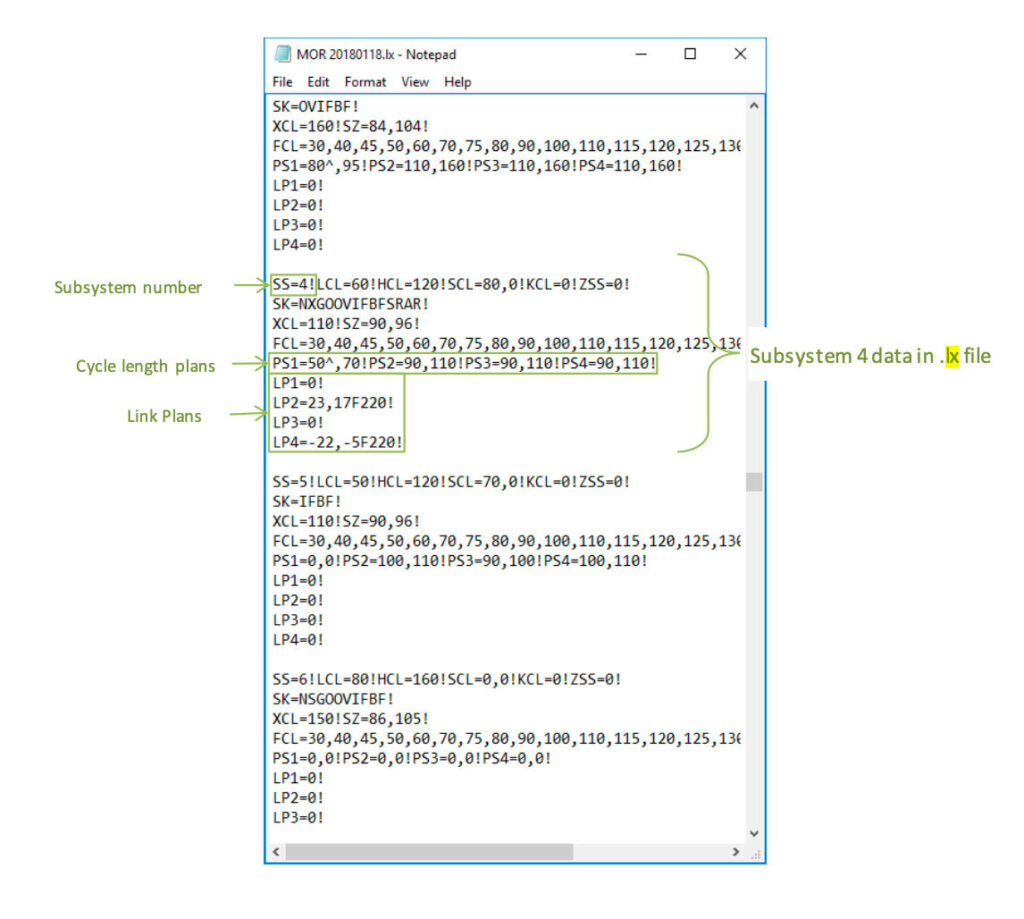
It appears the LX file for a given region can be purchased under restrictive terms and conditions at https://www.transport.nsw.gov.au/trafficsignal. The fee schedule is outlined at: https://www.transport.nsw.gov.au/system/files/media/documents/2022/Network_Operations_Schedule_of_Fees_01.08.22.pdf
My understanding is that the export is a manual process an operator must run, followed by manual clean up of the data and sending it.
A few items:
Explanation of Phasing – Detailed lay explanation of traffic signal phasing for a specified date. – $600
SCATS Traffic Counts (TCS graphics plots included): $300
Interpreted SCATS history files (TCS graphics plots included): $400
TCS graphic plots: $200
SCATS Region LX file (all TCS sites on region): $200
An LX file for a single SCATS region costs $220. I’m unsure how many intersections (ie. TCS sites) are in each region, but I know SCATS supports up to 250 intersections per region. I am unsure how many regions cover the City of Sydney for example.
There are also strong terms and conditions, however I see a permitted purpose is “(d) you undertaking traffic modelling or transport related projects,but excludes the right to sell, monetise or commercially exploit the Traffic Signal Information and/or Developed IP (Licence).”: https://www.transport.nsw.gov.au/trafficsignal/traffic-signal-portal-terms
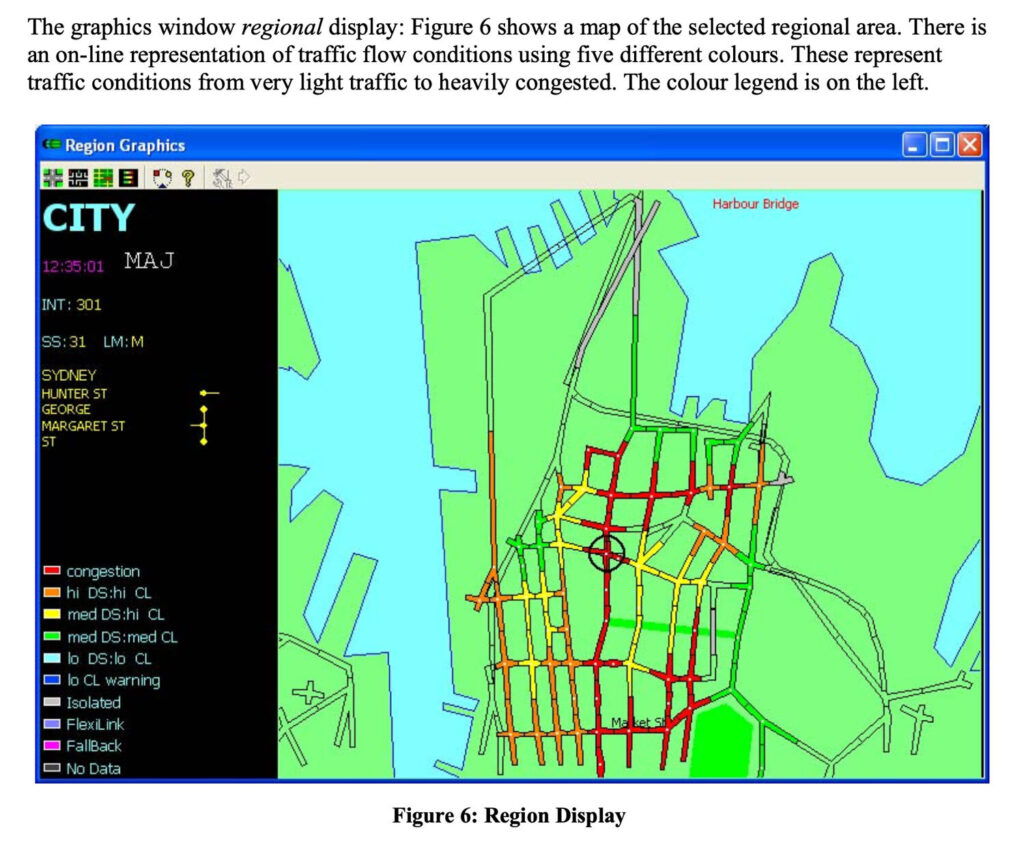
The SCATS regional traffic control software has a maximum capacity of 250 intersections per region. With a maximum of 64 regions, the total capacity is 16,000 intersections.
I note that on page 13 of “The New Generation SCATS 6” document there is an undated screenshot of a region display:
TfNSW reasoning against release of signal timing data in NSW
Response to my public Q&A question at the “SCATS – What is it and where is it heading” talk on 2025-02-06:
Question: Jake Coppinger, day job at Atlassian, volunteer with Better Streets, but representing myself here.
David Ballm (Director, Network Operations, Transport for NSW), transcript of Q&A question asked 2025-02-06 in public Q&A setting (SCATS – What is it and where is it heading?)
A question on open data and cycle times: My understanding is from mid-March, WA Main Roads will be able to release monthly dumps of their cycle times that were the real-time cycle time data. Do these upgrades enable that feature in New South Wales, or would we be able to release open data here? Thanks.
Answer: Essentially, the New South Wales government hasn’t determined whether or not we will release information completely on an AI platform on cycle time data.
We will do it at a user pay cost just because that open platform, I think, because that open platform hasn’t been developed yet. So, you know, we will provide that data. The way in which we present it at the moment, again, is very labour intensive, so, we charge for that data. Do we have any real objection to providing that data as operators, to providing that data openly? No, I don’t think so. But exactly what the government and transport at a senior executive level wants to do, obviously that hasn’t been determined yet.
SCATS upgrade
SCATS has been installed at more than 60,000 intersections across 200 cities and 30 countries worldwide.
A major upgrade is underway. The upgrade will likely involve a visual facelift, judging by the dated visual language of the diagrams generated, but little additional knowledge of the improvements is public.
There was briefly a desire for a new commercial model however this looks to have been abandoned.
“TfNSW is seeking to implement a new commercial model, with a commercial partner to accelerate innovation and importantly future-proof the SCATS product and business,” tender documents said at the time.
But the department has now ditched that approach, with a new team to be established within TfNSW to accelerate the development of SCATS and expand its commercial activities. (ITNews)
Do buses get signal priority? Which routes and when?
Information from the public “SCATS – What is it and where is it heading?” talk. Corrections are welcome as always.
Bus priority only exists on 5 or 6 bus routes in Sydney:
- Liverpool to Parramatta transitway
- North West Transitway
- A couple on routes on Windsor Road
The tech is relatively scalable – if decision made to give route priority, it can be done without major capital investments
Traffic signals only give priority if the bus is 50% full and are running 2-3 minutes behind the timetable.
I received correspondence that bus priority is also used in Newcastle and Wollongong.
There is, of course, priority for light rail/trams in various cities. In Sydney this proper prioritisation for the L2/L3 came after some time, but that’s another topic in itself.
Future signal development
Media reports on SCATS upgrade
In July 2021, It reported:
A spokesperson told iTnews that “after further work, TfNSW has chosen to proceed with a new structure, which extends on aspects of TfNSW’s original plan in 2019”, part of which will include “working with partners”.
https://www.itnews.com.au/news/transport-for-nsw-ditches-scats-traffic-system-commercialisation-566722
…
Features include better integration with third-party sensors, machine learning-based prediction, sophisticated analytics and performance reporting and a UI/UX refresh.
ARN reported in 2021:
Called the Sydney Coordinated Adaptive Traffic System (SCATS), it aims to trim travel time by a third, reduce fuel consumption by 12 per cent and lower emissions by 15 per cent, with more gains yet to be realised as the partnership pans out.
“Thanks to a new partnership with software development company Industrie&Co, our TfNSW development teams will collaborate to deliver the next generation of SCATS,” TfNSW deputy secretary for customer strategy and technology Joost de Kock said.
“SCATS uses algorithms and real-time traffic signal data to help customers get to their destinations faster and advanced sensors will allow cyclist and pedestrian movements to be included…
https://www.arnnet.com.au/article/693549/industrie-co-wins-transport-nsw-deal-new-scats-drive/
My understanding is that SCATs does not currently prioritise cyclist and pedestrian movements using any sensors – merely not skipping this phase when they are present.
https://www.arnnet.com.au/article/693549/industrie-co-wins-transport-nsw-deal-new-scats-drive/
More advanced pedestrian and cyclist detectors
Lidar detectors
In Victoria there is an ongoing trial using Lidar sensors to record road user positions in real time, which does currently feed data into the traffic light system. It can generate bounding boxes for vehicles, pedestrians, cyclists in real time and identify queues. I am unclear what the data from this trial will be used for.
My understanding is currently SCATS cannot natively use this Lidar input data as it does not have the capability to – the workaround is creating “virtual loops” that function like a magnetic resonance loop, giving a binary input to SCATS (with the added benefit of being able to create virtual loops for pedestrians). There has been development work on adding new SCATS interfaces but it has not been widely released. It is unclear if this will be included in the new SCATS upgrade.
There are multiple international vendors implementing traffic detection using Lidar, notably Velodyne’s Bluecity product.
Infrared and camera detectors
For pedestrians there is a trial in progress at Manly Wharf. This will likely also be applicable to areas outside schools; where there are usually few pedestrians, then many at once.
Infrared detection will be trialled at Manly Wharf where there is high pedestrian activity.
This trial seeks to address the requirement to enhance efficiency and safety at intersections with large variable volumes of pedestrian traffic.
This initiative aims to dynamically adjust intersection crossing times for pedestrians based on real-time detection. By using advanced detectors, we can:
“Pedestrian Detectors”, Intelligent Traffic Light Program, TfNSW
- Identify if a pedestrian is waiting in a designated zone
- Determine the pedestrian volume in the detection zone
- Analyse the demand for pedestrians
- Measure the time it takes for pedestrians to clear the intersection.
There is also an infrared camera trial for cyclists:
This trial aims to assess the performance of infrared cameras as a consistent and reliable method for detecting cyclists. Improved detection is anticipated to improve intersection efficiency and safety by reducing unused green phases and/or stranded riders.
Transport for NSW is planning to demonstrate the cameras in use at the Future Mobility Testing and Research Centre on the Community Open Day – 31 October 2024.
The proposed trial site is the intersection of Gardeners Road and Bourke Street in Alexandria.
This is a busy intersection due to the M8 off-ramp feeding into Gardeners Road. The traffic light phases are permanently configured to accommodate bicycles, regardless of their presence, causing unnecessary delays on Garden Road and impacting vehicle traffic flow. These factors make it an ideal testing site for this trial.
“Bicycle Detectors”, Intelligent Traffic Light Program, TfNSW
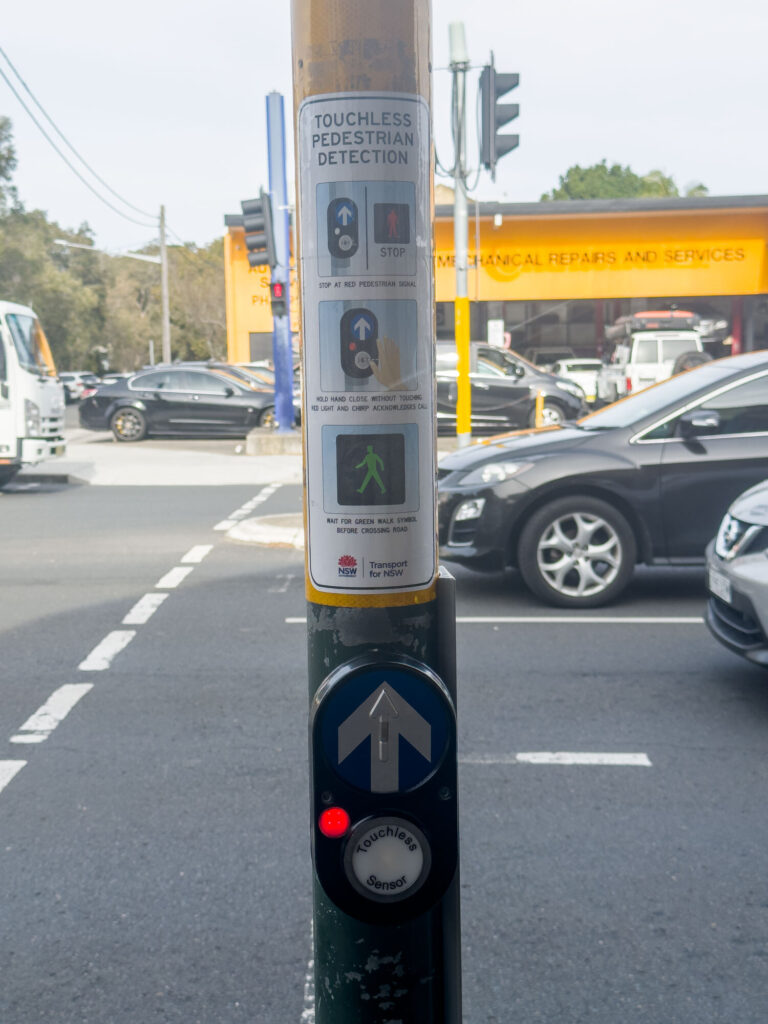
Touchless pedestrian activation trial
There are prototypes of touchless buttons with audio feedback when it registers an intention to cross.
In Melbourne there are examples of buttons with an acknowledgement light but no automatic sensor. These lights, with or without the automatic sensor, mean pedestrians know whether they have to press the button or not. There are some disadvantages however:
When automatic introduction is activated, the red ‘wait’ light on the push button assembly is illuminated at all times that the pedestrian signals are not showing a green man (see Figure 1). This is a helpful indicator that the pedestrian does not need to push the button as a ‘call’ is already recorded. In bright sunlight, it can be difficult to see whether the wait light is illuminated or not. In a quick survey of sites in the CBD, it looks like not all push buttons have the ‘wait’ light. At William St/Bourke St, for example, only 1 of the 8 push button assemblies includes a ‘wait’ light.
Review of Signal Operations for Pedestrians in the City of Melbourne, David Nash, 2014
An example of this button is at Henderson Rd & Garden St. Acknowledgement of the intention to cross is displayed with a red light on the button and an audible beep.
Additional notes
The Sydney CBD effectively operates as a fixed time system during peak times
…but without the benefits of a fixed time system, such as pedestrian timers counting down until the end of the red light, rather than until the end of the green light.
SCATS will attempt to increase the length of a green phase for cars to satisfy the demand when the “degree of saturation” is high (as measured by cars travelling over magnetic resonance loops in the ground) – that’s what the “Adaptive” in Sydney Coordinated Adaptive Traffic System means. However, SCATS will only increase the green time such that it won’t make the cycle time higher than a given value (the maximum cycle time).
In the Sydney CBD, the 90 second figure is the maximum cycle time. If the SCATS algorithms determine there is no need (for cars), the cycle time will drop lower. Measurements of actual cycle time are recorded and can be accessed in the SCATS software, and to request this data you must pay $400 per intersection – see the section below on SCATS data cost.
With a 90 second cycle in the Sydney city, there usually isn’t any spare time in a cycle for SCATS to adjust the phase length (especially for bidirectional roads with more cycles), and will usually be running constantly at 90 second cycles (unless in off peak periods).
As a result of these decisions, this results in the Sydney CBD effectively operating as a fixed time system during peak – that is, the phase lengths are very similar to the expected, pre-programmed length.
The traffic signals tend to operate a peak of 1.5/2 hours in the morning and 2 – 3 hours in the afternoon.
In off peak periods it can sometimes run down to ~50 seconds.
That’s all folks!
Once again, I hope this article demonstrates why signal data should be as public as a train network timetable – and subject to the same public scrutiny and debate as one (even though complex trade-offs are involved) and I hope this document provides plenty of source material and an overview of the landscape for other advocates to dive into.
Note: I am not a trained traffic engineer; my background is computer science and I work as a software engineer. This analysis is a side project. Please let me know of any mistakes, corrections or improvements in the comments below (or privately to [email protected]) and I will update if incorrect.
Further reading
Apologies for the haphazard referencing!
- ARRB Research Report 123 Traffic Signals: Capacity and Timing Analysis (1981). https://www.sidrasolutions.com/media/189/download
- Pedestrians should get the green light on traffic signal prioritisation, Cecilia Duong https://www.unsw.edu.au/news/2021/07/pedestrians-should-get-the-green-light-on-traffic-signal-priorit
- Python implementation of SCATS LX data reading (I haven’t read through), https://github.com/johntrieu91/scatsutilities
- Sydney CBD Cycleways Traffic Signals Optimisation, A Finlay, https://roads-waterways.transport.nsw.gov.au/documents/roads/bicycles/bicycles-sydney-cbd-traffic-signal-optimisation-2009.pdf
- “Traffic Signal Design Guide: Section 7 Phasing and Signal Group Display Sequence” (2016). URL appears to be currently broken (this is an archive link). Unsure if it’s been superseded. Great info on various types of pedestrian phase protection.
- Signal Data Information for Modelling report (Main Roads WA). Page 48 has some info on the LX timing format
- Review of Signal Operations for Pedestrians in the City of Melbourne, David Nash, 2014
- “The New Generation SCATS 6”, date unknown
- New TfL data shows success of innovative ‘pedestrian priority’ traffic signals, 24 February 2022, TfL
- Post metadata image: http://www.jctconsultancy.co.uk/Symposium/Symposium2014/PapersForDownload/A%20Review%20of%20SCATS%20Operation%20and%20Deployment%20in%20Dublin.pdf
- Traffic lights in ’s-Hertogenbosch; an interview, Biycle Dutch: https://bicycledutch.wordpress.com/2016/06/21/traffic-lights-in-s-hertogenbosch-an-interview/
- “The Evolution of Traffic Signal Operations”, TfNSW, March 2024: https://www.transport.nsw.gov.au/system/files/media/documents/2025/Active-Transport-Community-of-Practice-Evolution-of-Traffic-Signal-Operations-March-2024.pdf
- “Pedestrian Safety” brochure, September 2020, TfNSW, https://www.transport.nsw.gov.au/system/files/media/documents/2023/Pedestrian%20Safety.pdf (file removed, archived 2025-05-15 from the original https://web.archive.org/web/20250515002811/https://www.transport.nsw.gov.au/system/files/media/documents/2023/Pedestrian%20Safety.pdf), https://www.transport.nsw.gov.au/system/files/media/documents/2025/crs_pedestrian_safety.pdf
- “Traffic Signal Operation” (Superseded standard), RTA-TC-106, April 2010 (“First published in this form October 1991, Reformatted October 2000, Revised April 2010”), https://standards.transport.nsw.gov.au/_entity/annotation/6b38b3c7-b835-ed11-9db1-000d3ae011f9
- “Traffic Signal Operation”, TS 05493:1.0, RTA-TC-106, 18 November 2024, Revision 1.0 (replacing First issue as RTA-TC-106 effective 1 April 2010), https://standards.transport.nsw.gov.au/_entity/annotation/5c3b61e9-4ea5-ef11-b8e9-000d3a6b1b0b
- “Staying safe as a pedestrian”, TfNSW (NSW Centre for Road Safety), https://www.transport.nsw.gov.au/roadsafety/pedestrians/staying-safe
- “Pedestrian Priority at Traffic Signals”, Network Operations, TfNSW, February 2023, (supplied) http://files.jakecoppinger.com/traffic-signals/Pedestrian+Priority+-+Public+Presentation+V2.pdf
Leave a Reply