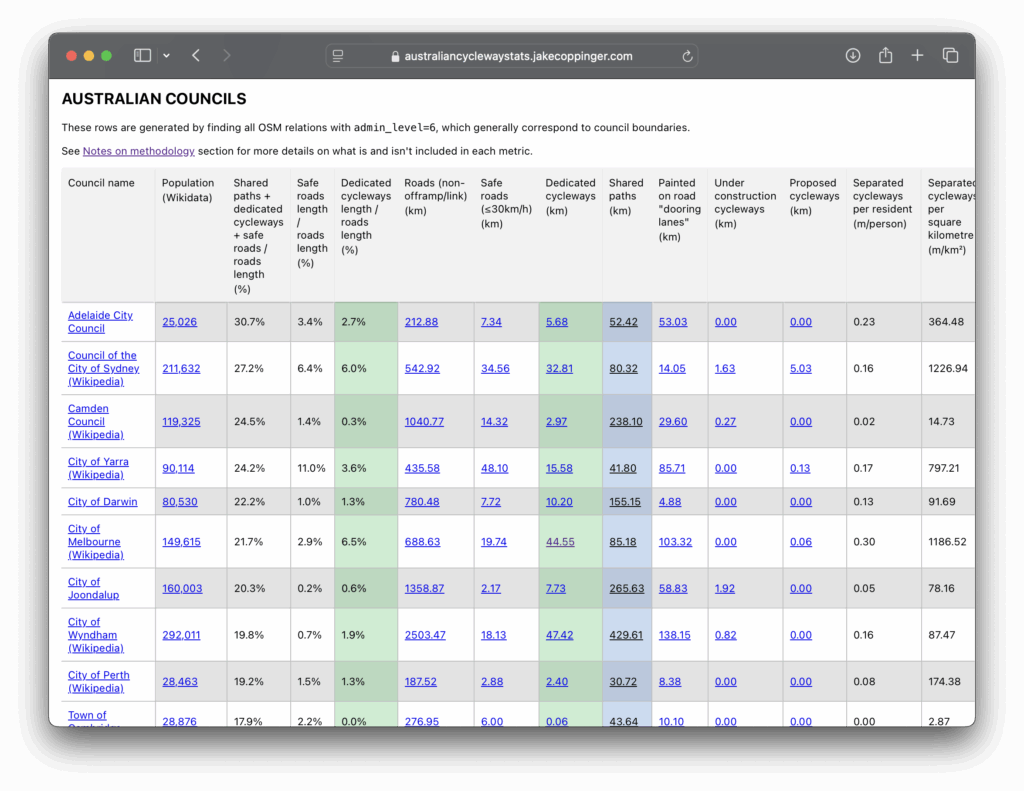
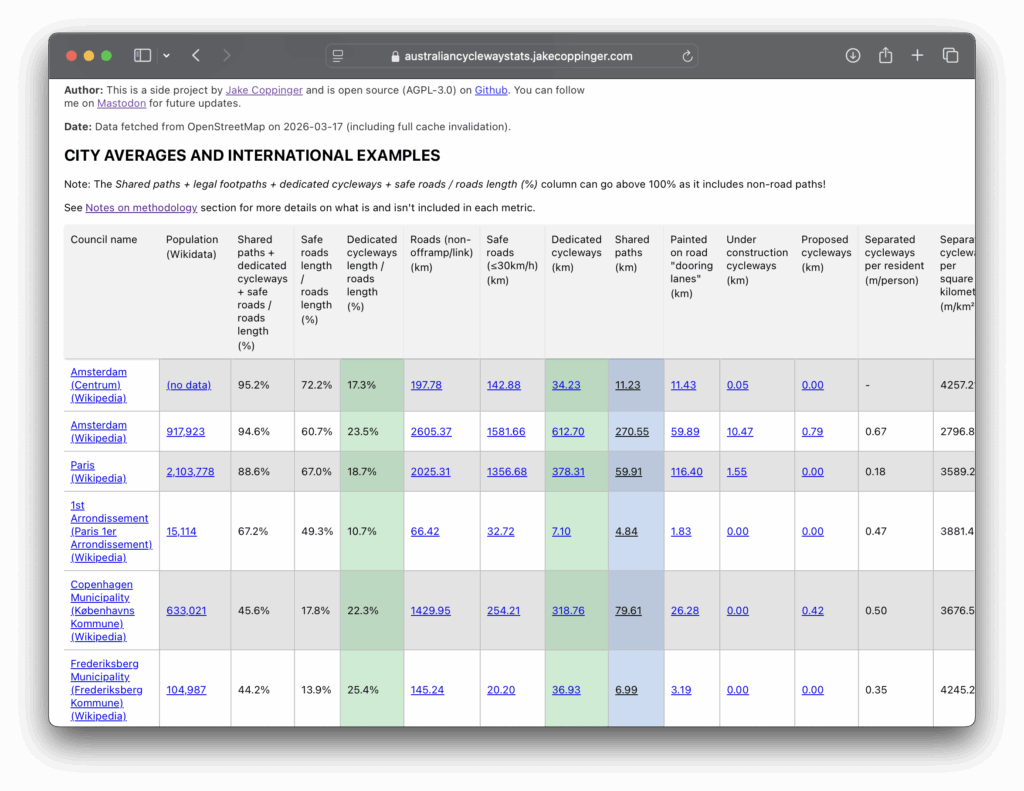
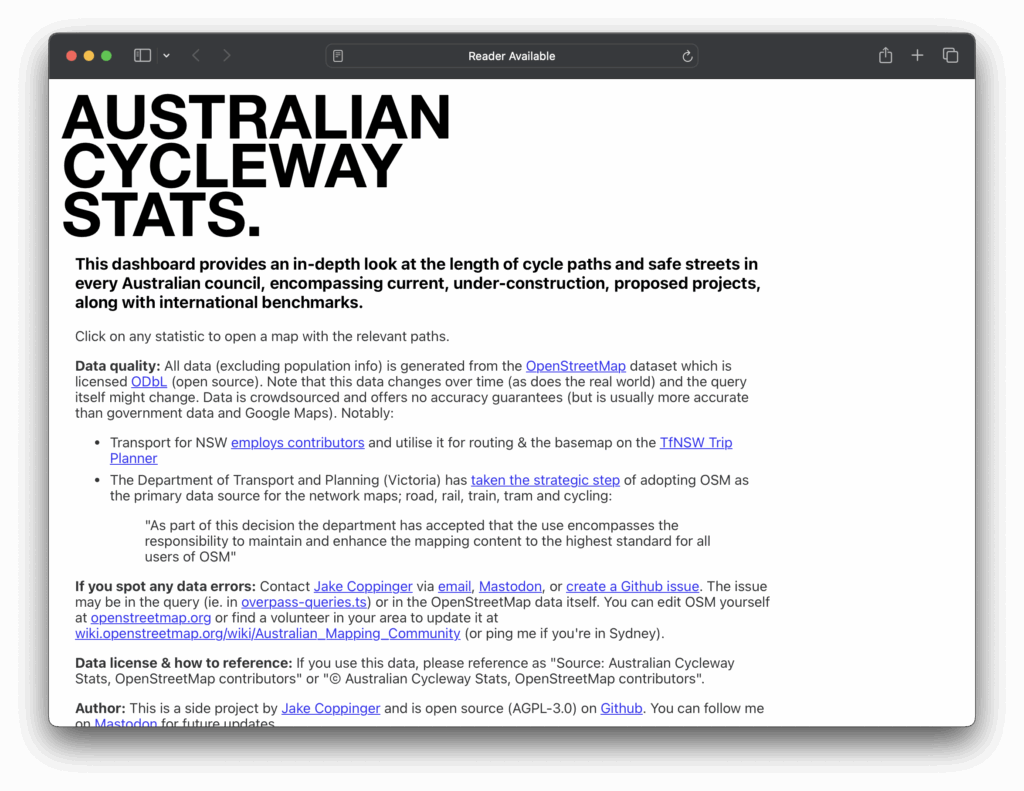
Australian Cycleway Stats now compares cycleway length per resident and per sq/km – comparing Australian councils with world-leading cities. This tool remains AGPLv3 open-source.
These are not great metrics, but are useful heuristics – including for verifying and comparing claims of density and network length metrics per council (a pertinent topic!) with deterministic, open source calculations on human-verified consensus-based data (OpenStreetMap – which I contribute to almost daily).
A better metric, perhaps the most important, is cycling access using safe streets and cycleways – and one I am deeply passionate about. Affordable homes where people want to live need safe access to destinations people want to visit (without burning oil). Measuring this metric is important – almost as important as increasing it.
UrbanSpectra is open to work for evaluating, modelling, visualising and communicating urban data – and has an exciting product in development. If your private or public organisation is looking for rigorous analysis or tools using such data, or is interested in an early demo of this product – get in touch!
UrbanSpectra‘s capability statement is published at urbanspectra.com/capability-statement/
Leave a Reply