On the 7th of January 2018, Transport for NSW (TfNSW) pulled off something extraordinary – and I personally paid $441 to obtain the previously secret reports documenting it.
Overnight, traffic signals across the core of Sydney’s CBD were reprogrammed to show a green light more frequently – at least every 90 seconds. This reduced the maximum wait time by a full 20 seconds (from the previous maximum cycle time of 110 seconds) for every pedestrian, cyclist and motorist.
TfNSW studied traffic patterns for 3 months afterwards in unpublished daily qualitative observation reports, sent out traffic survey experts to walk laps of streets with a stopwatch, and record any bus delays…and those results were unbelievably positive for everybody – people walking, buses and vehicles:
- People walking spent up to 40% less time waiting at traffic lights on average on some streets, and over 18% improvement on every measured street[1]: 1 (92% of trips within the Sydney city centre are on foot[2])
- “Buses continued to operate normally”[3][4], on most streets they ran faster, and on one street they arrived an average of 3.6 minutes earlier [5][4]: 5 – so much faster bus drivers were unable to drive slow enough to meet the old timetable! (only one of the streets analysed had slower buses, with <50s avg. delay behind timetable)
- Within only 8 weeks[4]: 4 , car traffic had apparently evaporated (traffic evaporation[6] is the opposite of induced demand, as per the Law of Peak-Hour Traffic Congestion (1962)[7][8]), the “Network worked well”[4]: 4 and “General traffic vehicle travel times were operating as normal with the exception of a couple locations in the CBD”[3].
- “The project has been a success”[4].
With such impressive results and a successful permanent implementation for a subset of the CBD, why doesn’t TfNSW run more cycle time reduction trials? Why not for the whole inner city, as Clover Moore formally requested almost 7 years ago?[9] Why not on every high pedestrian activity area in NSW, including urban arterials?
The number of people being killed while walking is increasing. As of 2025-09-23, pedestrian fatalities are rising 27% year on year in NSW[10] (rising over three times faster than car driver fatalities). More people walking are killed in the City of Sydney than any other LGA in NSW[11]: 6 , but the council has no power to reduce speed limits or change signal operation.[11]: 19
Despite clear evidence that shorter signal cycles reduce wait times and improve safety for pedestrians[12][13][14][15], and in their own words “Shorter wait times…could potentially reduce the risk of jaywalking and pedestrian crashes”[16][17], TfNSW has not expanded this successful program beyond the CBD in the City of Sydney. Along with the desperately needed reduction of urban state road speed limits to 40km/h[11]: 12 , why hasn’t TfNSW doubled down on this proven solution? Why isn’t TfNSW writing papers on pedestrian wait-time reduction, similar to the recent award winning study from Manchester by Josef Whitfield?[18]
Walkable and bikeable streets are good for business.[19] Improved access brings agglomeration productivity benefits: improving pedestrian connectivity and “prioritising pedestrian crossings” is action 4D of the Tech Central Economic Strategy (released this month).[20]
Improving life between buildings with walkable streets make dense neighbourhoods not just possible, but desirable. Our streets and public spaces determine whether dense development enhances or diminishes quality of life. Legacy traffic modelling recommended against pedestrianising George Street[21]: 34 , now perhaps Sydney’s greatest street.[22]
TfNSW’s Road User Space Allocation Policy states that temporal allocation should consider pedestrians before cars (and all other modes). This policy is mandatory[23] though only sometimes followed.[21] The Roads Act 1993 Review[24] should formalise the road user hierarchy into the objects and intent of the Act.[25][26][27][28][29] TfNSW could highlight the results of this project to show their international customers that the Sydney Coordinated Adaptive Traffic System (SCATS) system is able to be “policy responsive” (per their sales materials[30]).
We don’t need to wait another quarter-century to stop killing people walking on local streets – Oslo[31] (which typically uses even shorter cycle times of ~50 seconds[32]) and Helsinki[33] have already achieved zero pedestrian fatalities in one year, likely as a result of 30km/h urban speed limits, fewer cars, and shorter signal cycle times. If we want a different outcome we have to do something different – and these documents uncover just how great the change is.
The GIPA[a] 25T-1151 material suggests prioritising pedestrians can deliver measurable economic and safety benefits at minimal cost – and who doesn’t want to wait less at traffic lights?
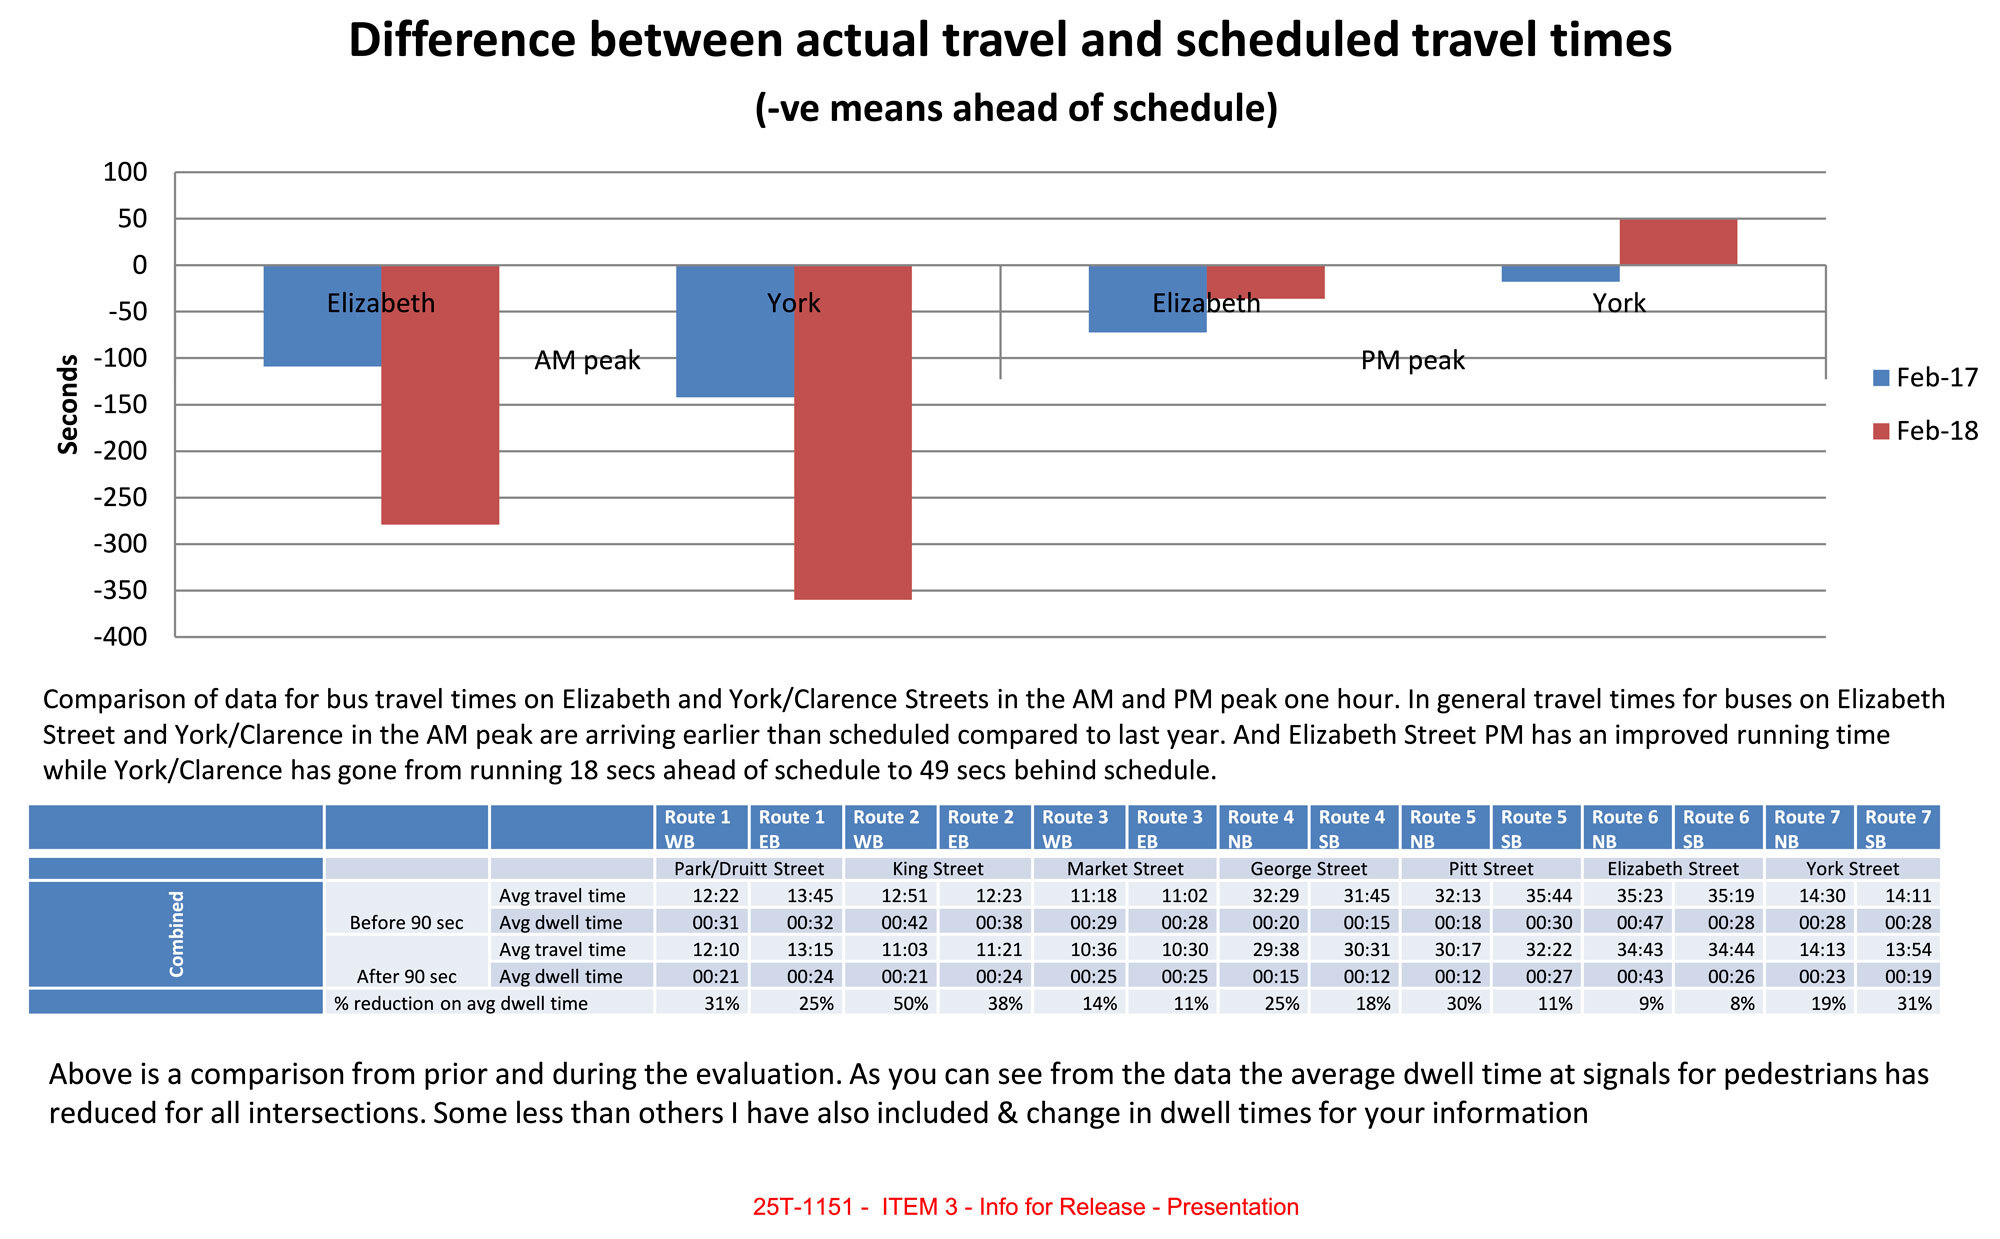
Image: Page 5 of the presentation
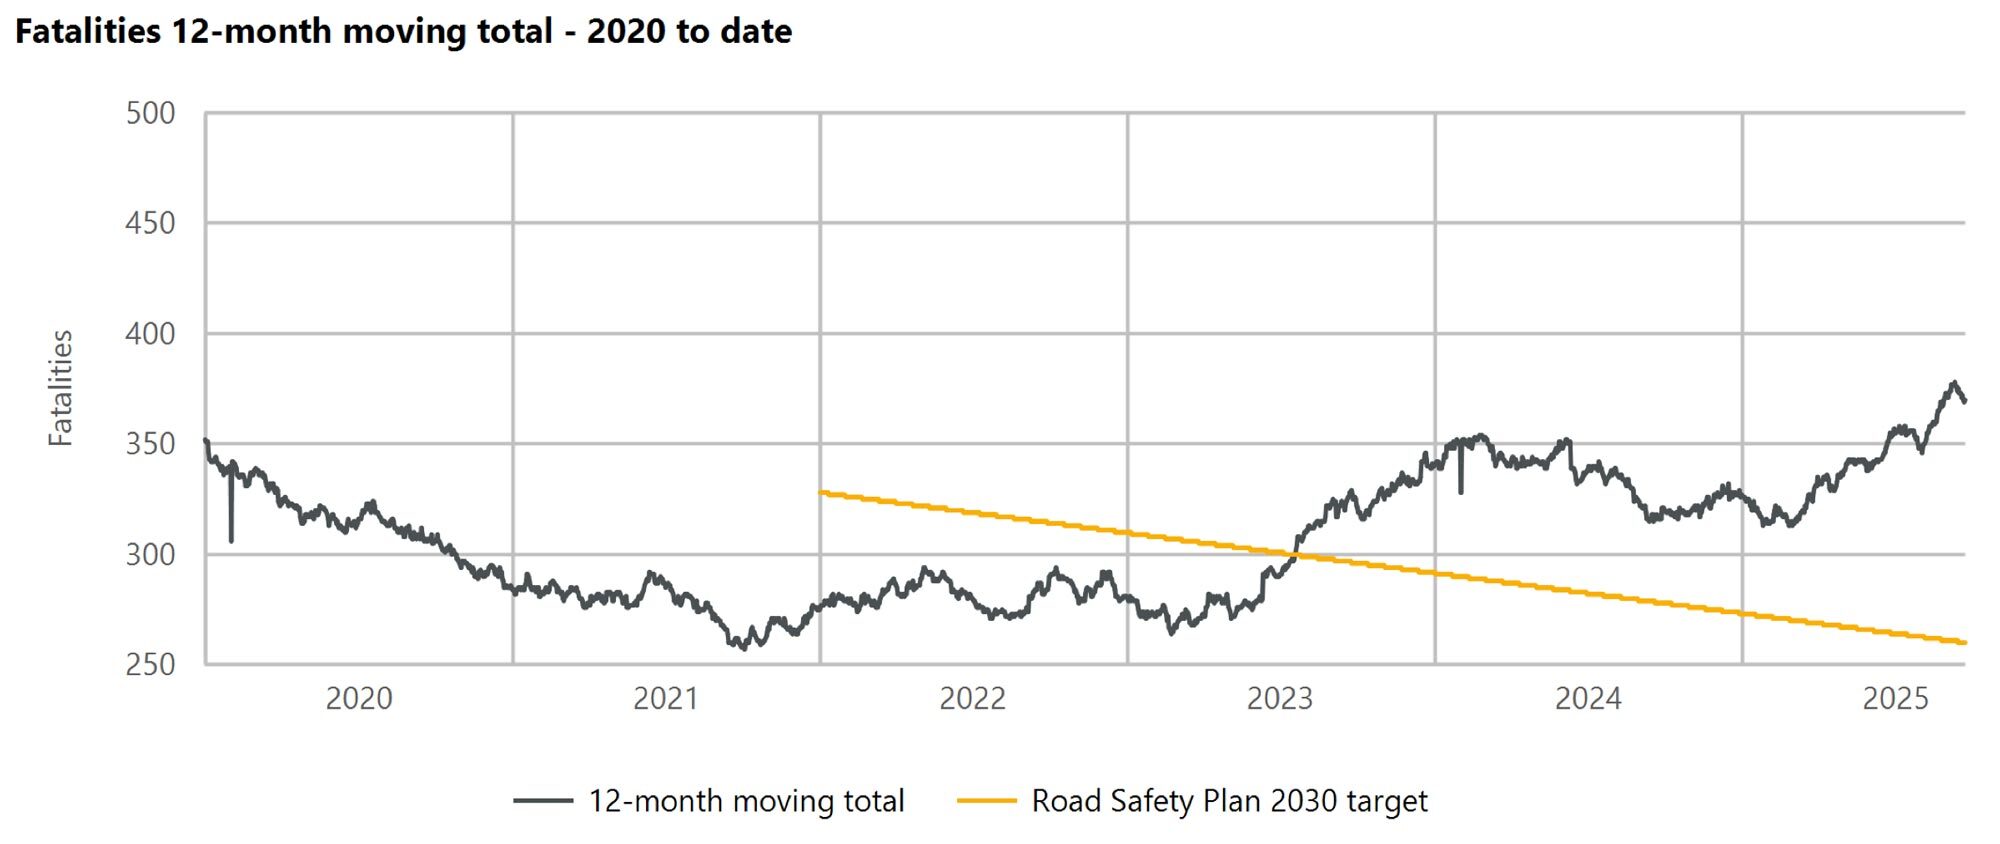
Image: NSW Fatalities 12-month moving total – 2020 to date (2025-09-23)
Overview
This analysis is a personal side-project. I initiated the information request on February 3rd 2025[34] and proceeded with the release at a personal cost of $441.
I am not a traffic engineer! If you have corrections, suggestions or constructive criticism I would greatly appreciate it. Feel free to drop a comment below or email me privately at [email protected]. I have released all documents and code openly for further analysis, reproduction, and research (OCR / perceived congestion git repo, Observable visualisation notebook).
Live in Australia and want to improve your local streets? Run out of Not Just Bikes episodes to watch and want to learn how change actually happens? Join Better Streets! Drop me an email – I’ll invite you to the Slack (where the magic happens) and point you to the communities and individuals in your city/suburb to learn from and collaborate with. See their views, recommendations (and 114 business and community organisation partners so far) at https://www.betterstreets.org.au/coalition.
I worked for the past 5 years as a full-stack software engineer at Atlassian. I’m currently working on a commercial project with an organisation I’m very excited about – I’m looking forward to showcasing that work in the coming months.
I’m planning to build more commercial software in the walking / cycling / planning space. I’m pretty passionate about these fields if you didn’t gather from this blog post! See a summary of side projects I’ve worked on in the past ~5 years here.
Get in touch at [email protected] or on Mastodon at @[email protected].
Maps
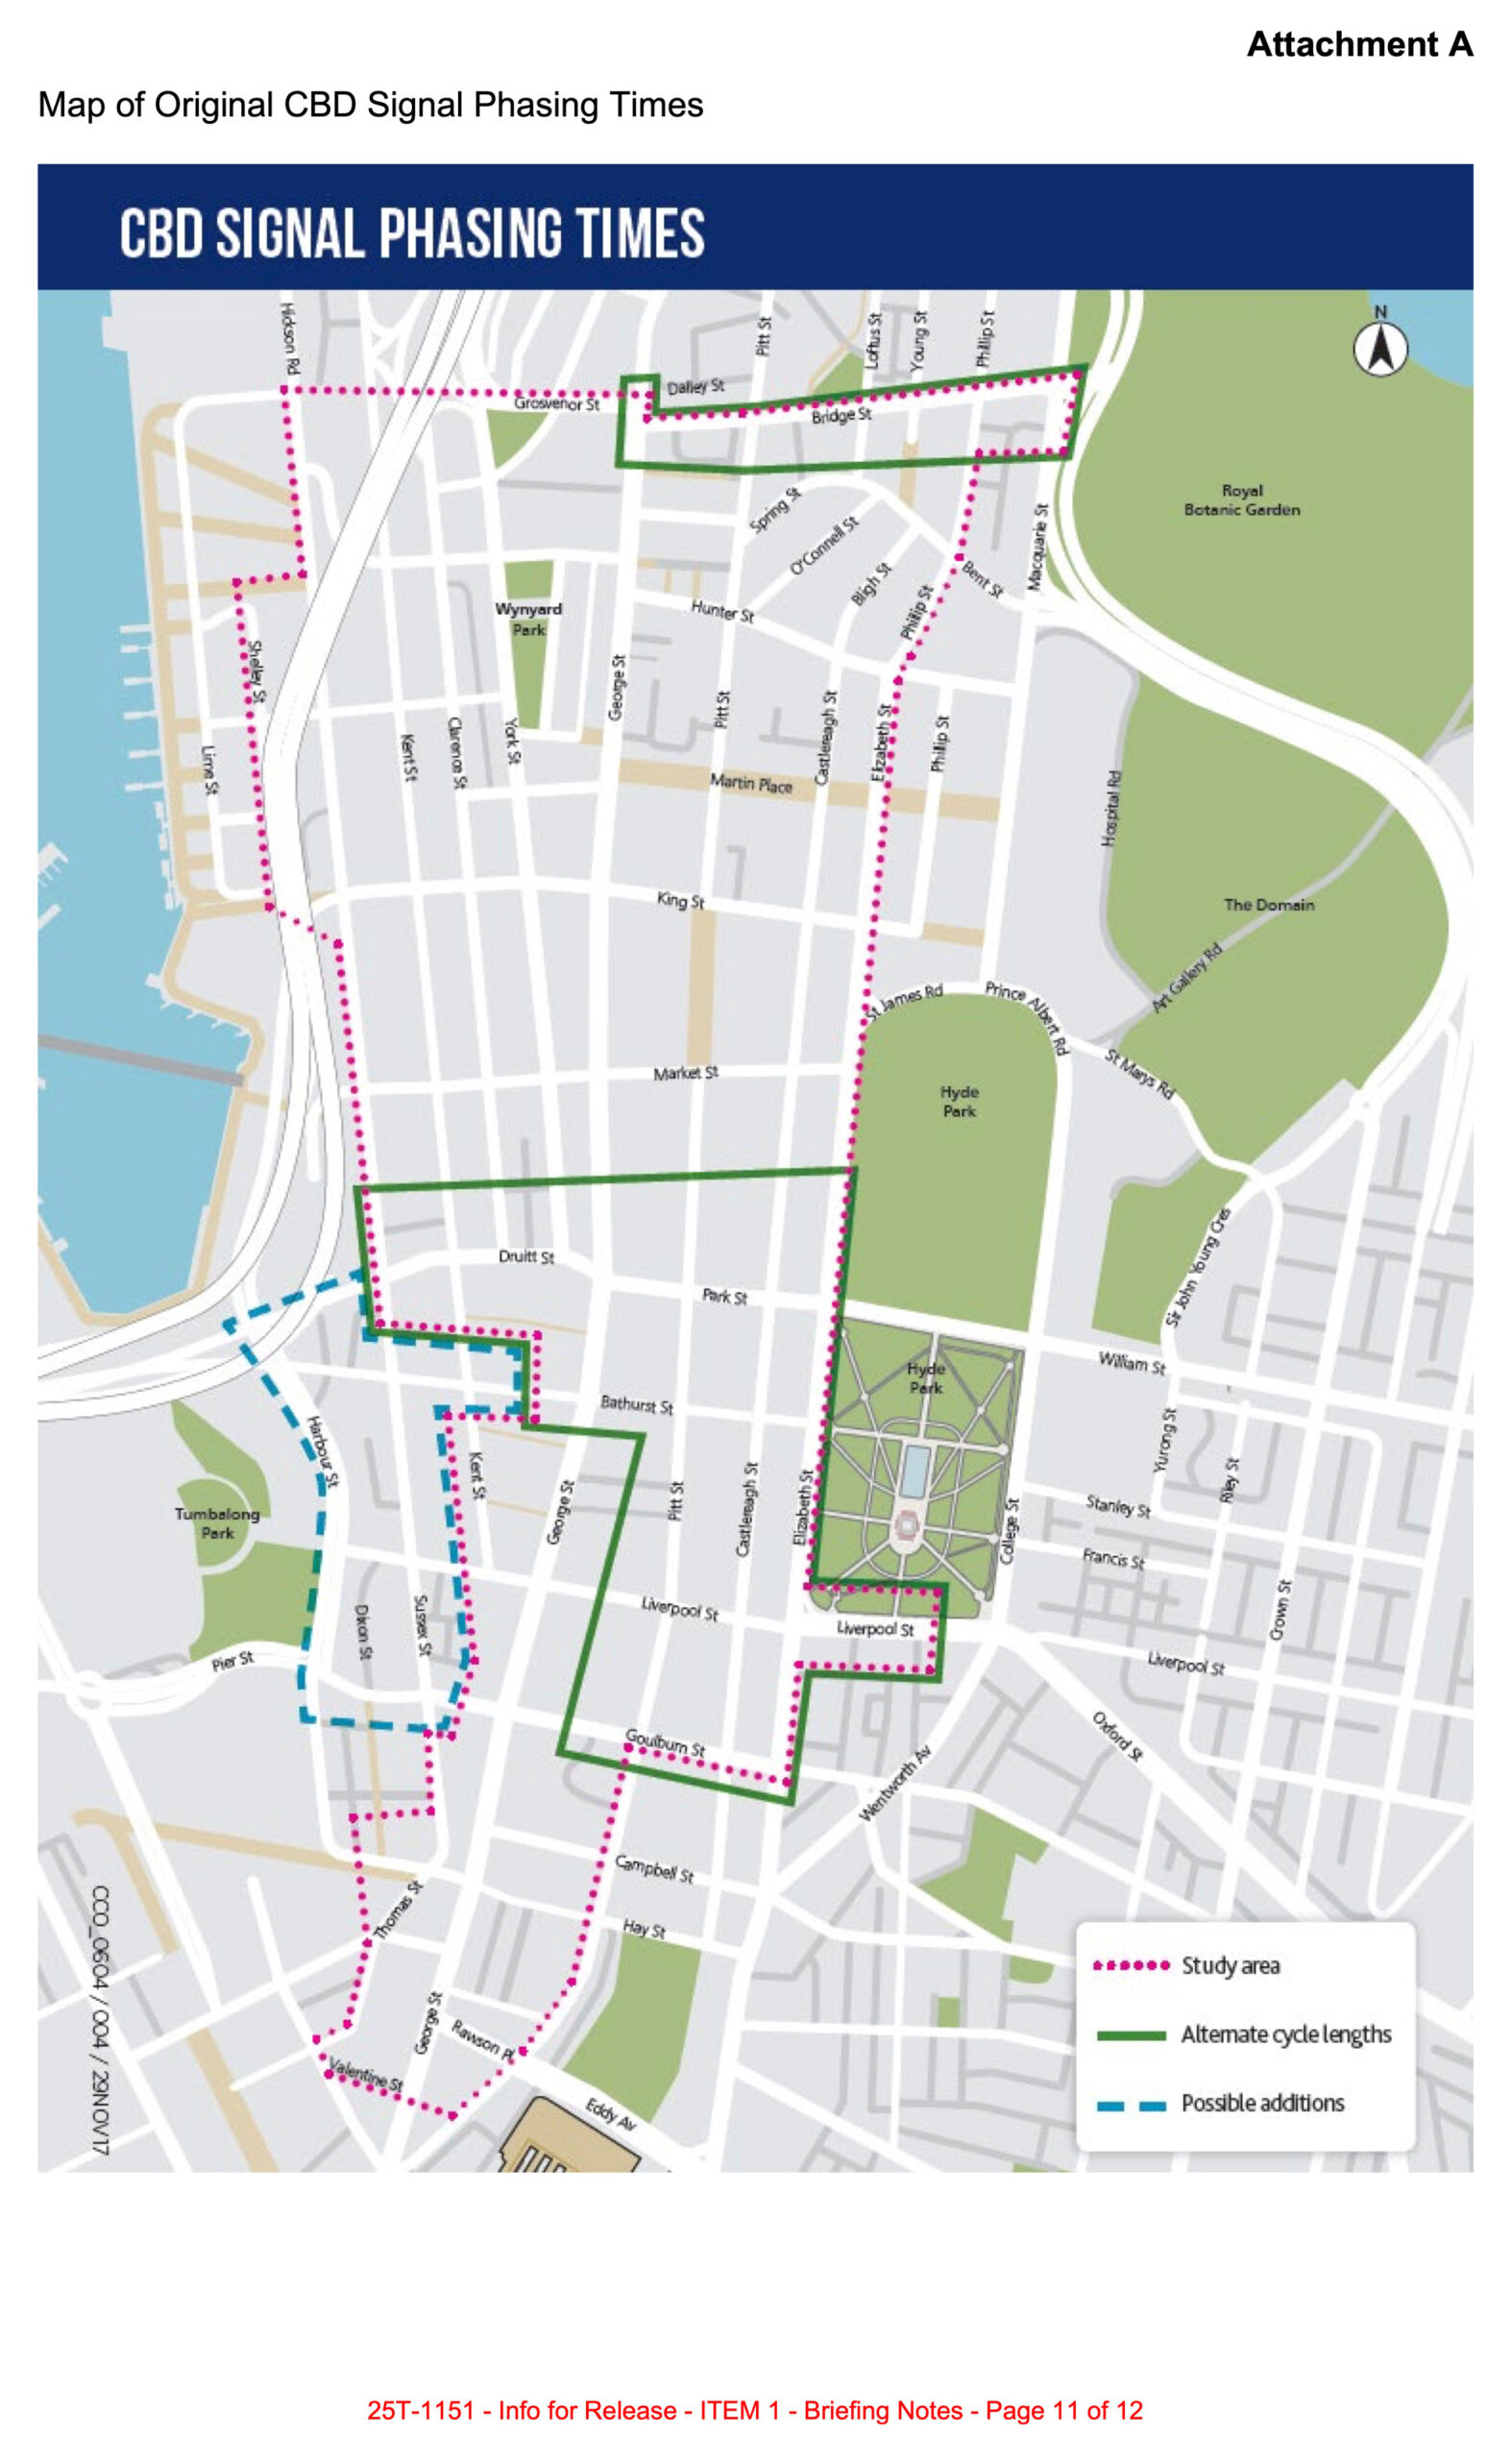
Map of Original CBD Signal Phasing Times
This map is dated 2017-11-29.[35]
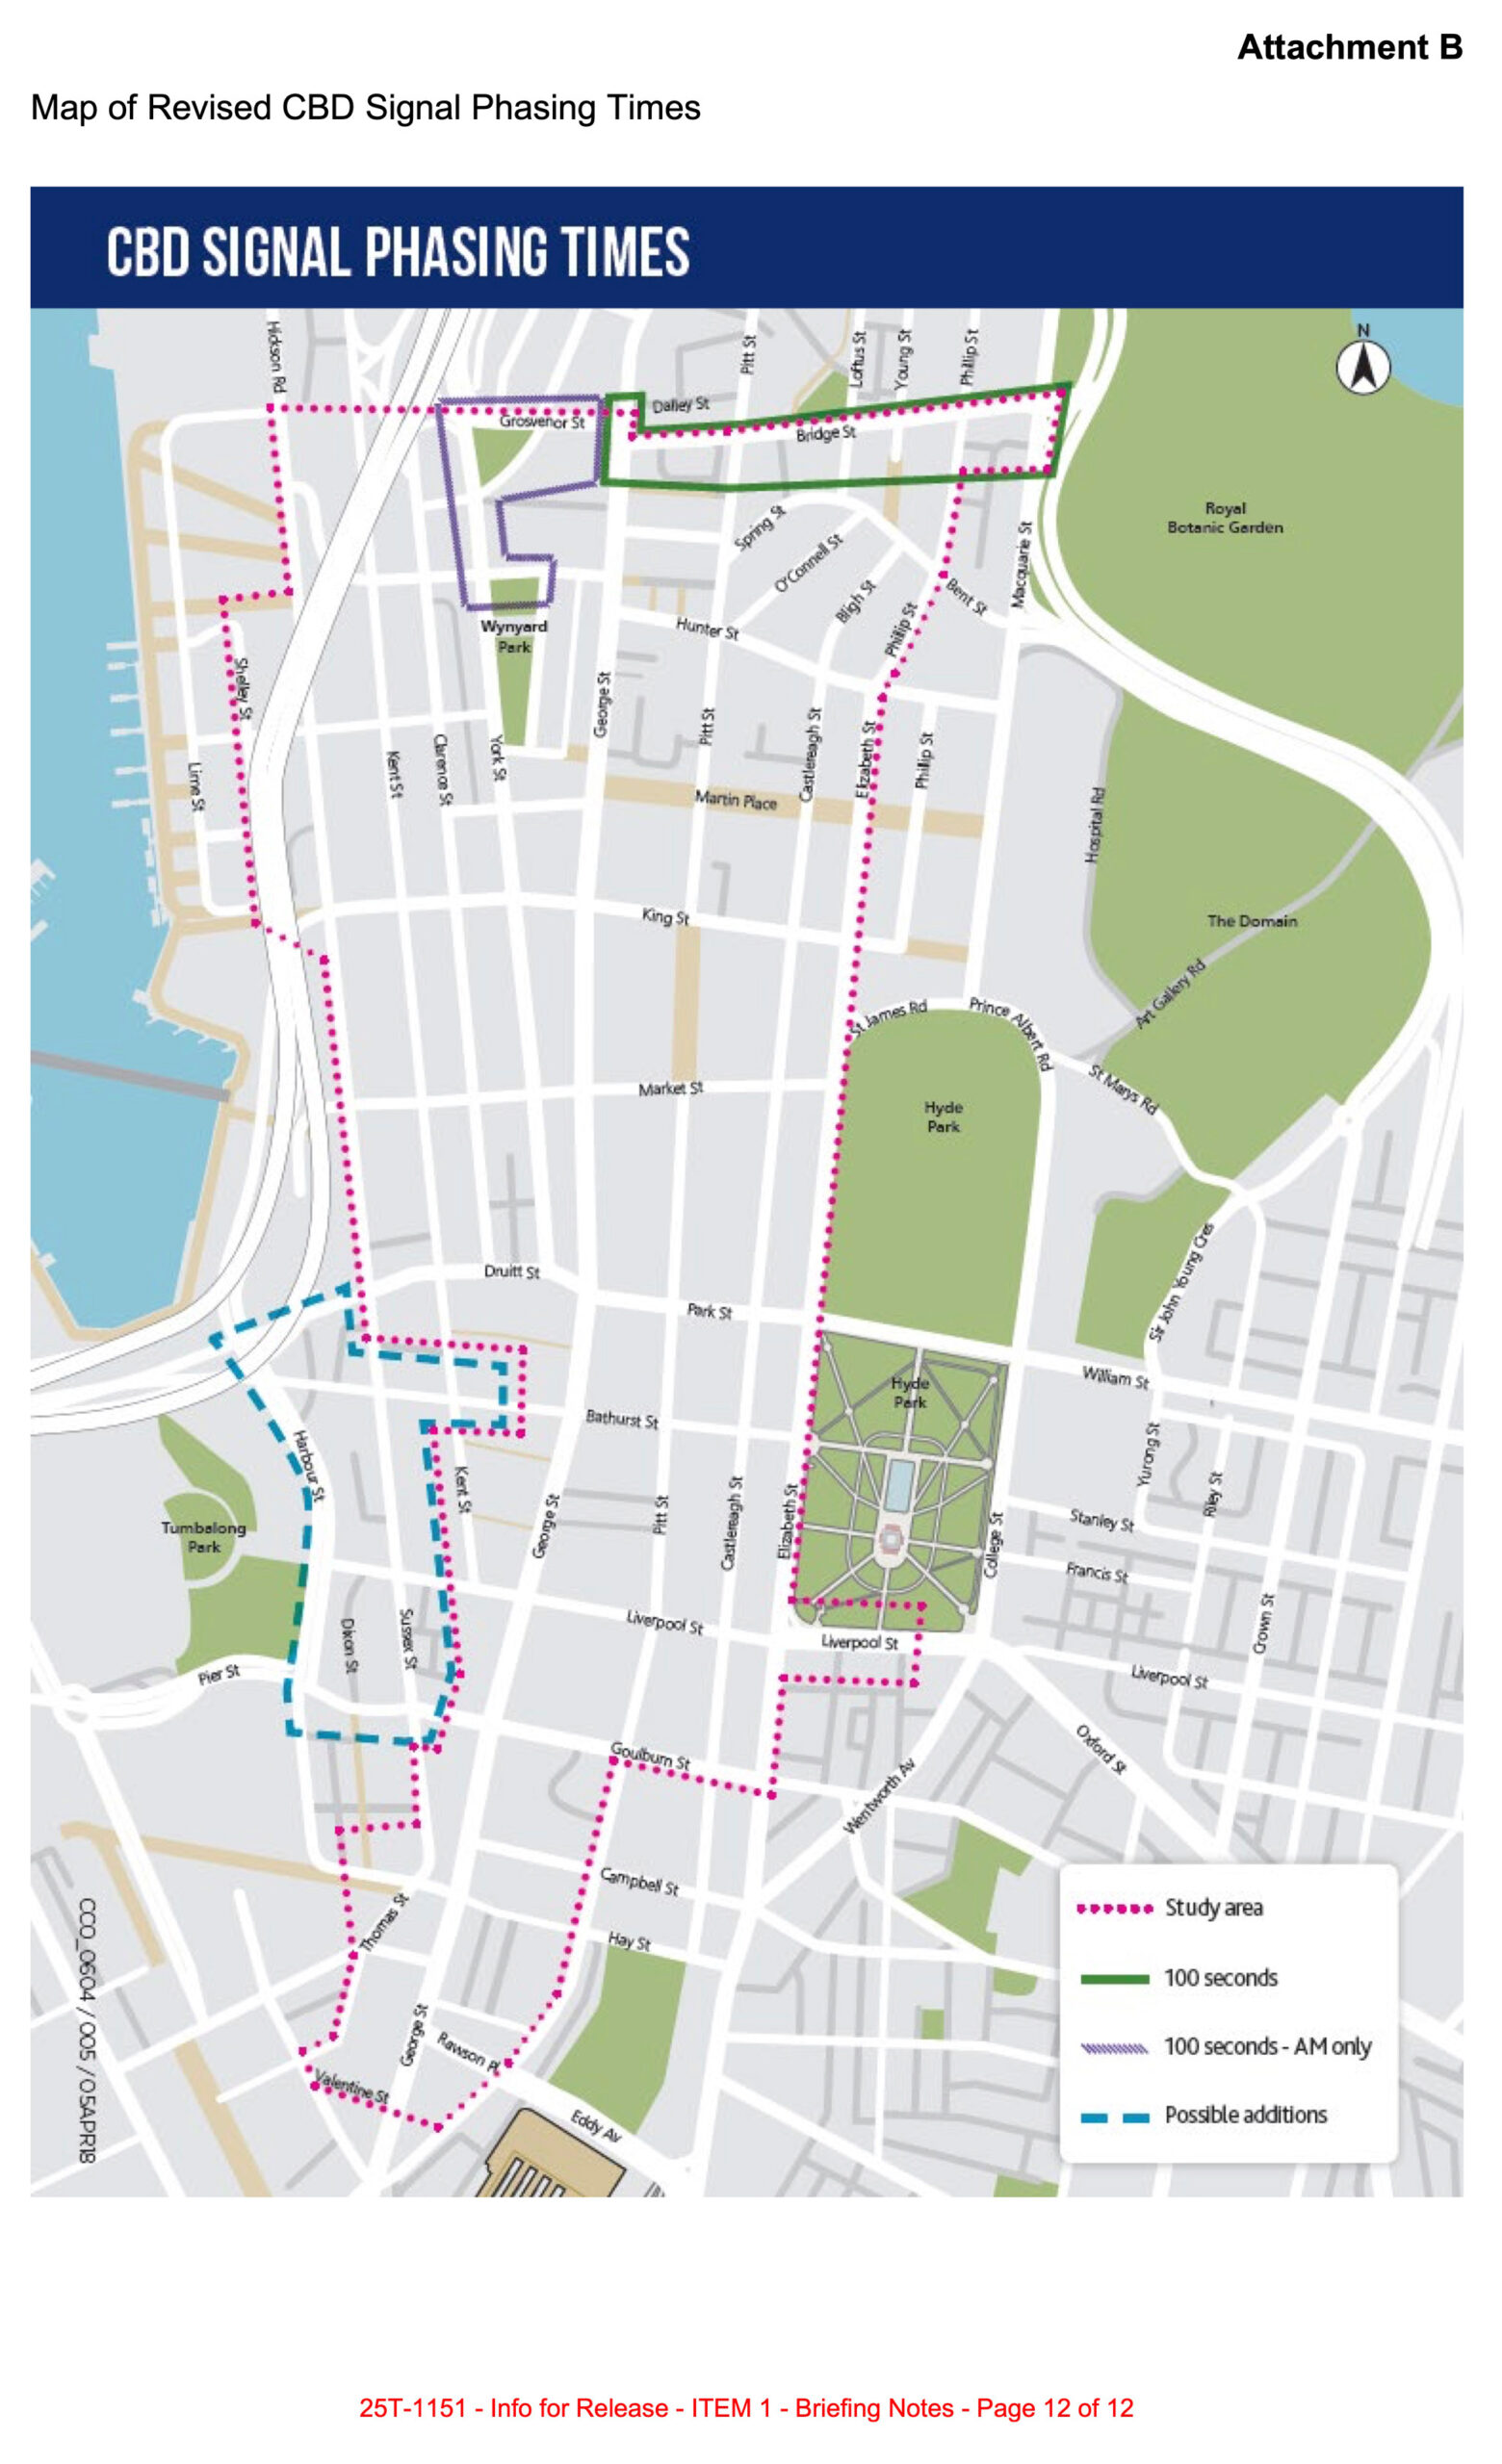
Map of Revised CBD Signal Phasing Times
I previously published this map (CCO_604/005/05APR18) as a vector PDF[36] in “Shining a Light on the Traffic Signals of Sydney” (2023).[37]
Analysis 1: How much shorter could traffic signals run through their cycles in Sydney’s CBD?
One of the documents in GIPA[a] 25T-1151 is an audit of traffic signal cycle times dated November 2017.[38] This document includes a Min. time column, which appears to be the minimum possible cycle time for each signal.
Minimum cycle times specify how low cycle times can be while ensuring a safe amount of time is provided to each phase. By design, SCATS increases signal cycle time to accommodate detected vehicle volumes, until the maximum cycle time is reached. The maximum cycle time is an arbitrary ceiling set in the SCATS software to limit worst case outcomes for pedestrians and cyclists. Maximum cycle times settings of traffic signals are a numerical representation of the prioritisation of different modes of transport.
A claim advocates often hear is that traffic signal cycle times are already as low as they can be. However, this document suggests otherwise.
This analysis of TfNSW data suggests over 85% of signal sites within the CBD study area have minimum cycle times less than sixty seconds, significantly lower than the current maximum cycle time of 90 seconds (excluding sites definitely changed since 2017). In other words, most signals in the Sydney CBD could show a green light more often. It suggests TfNSW could further reduce cycle times of signals in the Sydney CBD. There is no public data showing otherwise. TfNSW has refused[39] to publish timing data on signals for anywhere in NSW – “As previously advised, Transport for NSW does not publish the SCATS Signal Phasing data you requested and currently has no plans to make this information publicly available.” (Howard Collins, Coordinator-General TfNSW, 2025-08-25[40]).
All data in this section is from 7 years ago, but it’s more than the public has ever seen before. While specific charts imply which signals have likely changed or remain the same, the only way to understand how the current situation has changed is open data on traffic signals timing in NSW.
An early draft of this analysis was presented at the 2025 TransportCamp Sydney one-day ‘unconference’[41]. Thanks to all those who have provided feedback!
I was told at this conference by a TfNSW employee that one sensitivity of open signal data was the perceived risk of private bus operators initiating legal action in the case of missed on time running targets. If a valid risk, this is certainly a perverse outcome of private bus operator contracts. I hope the (positive) results showcasing that buses ran earlier addresses this concern. In any case, from first principles – if buses are provided with a dedicated lane and there are no split failures at signals for the bus lane (i.e. as long as there isn’t a line of 10 buses), more frequent green lights should benefit buses just like pedestrians. If a bus route often runs late, buses should be provided with a dedicated lane. Such changes only require paint and software tweaks, not concrete.
Methodology
Data meaning
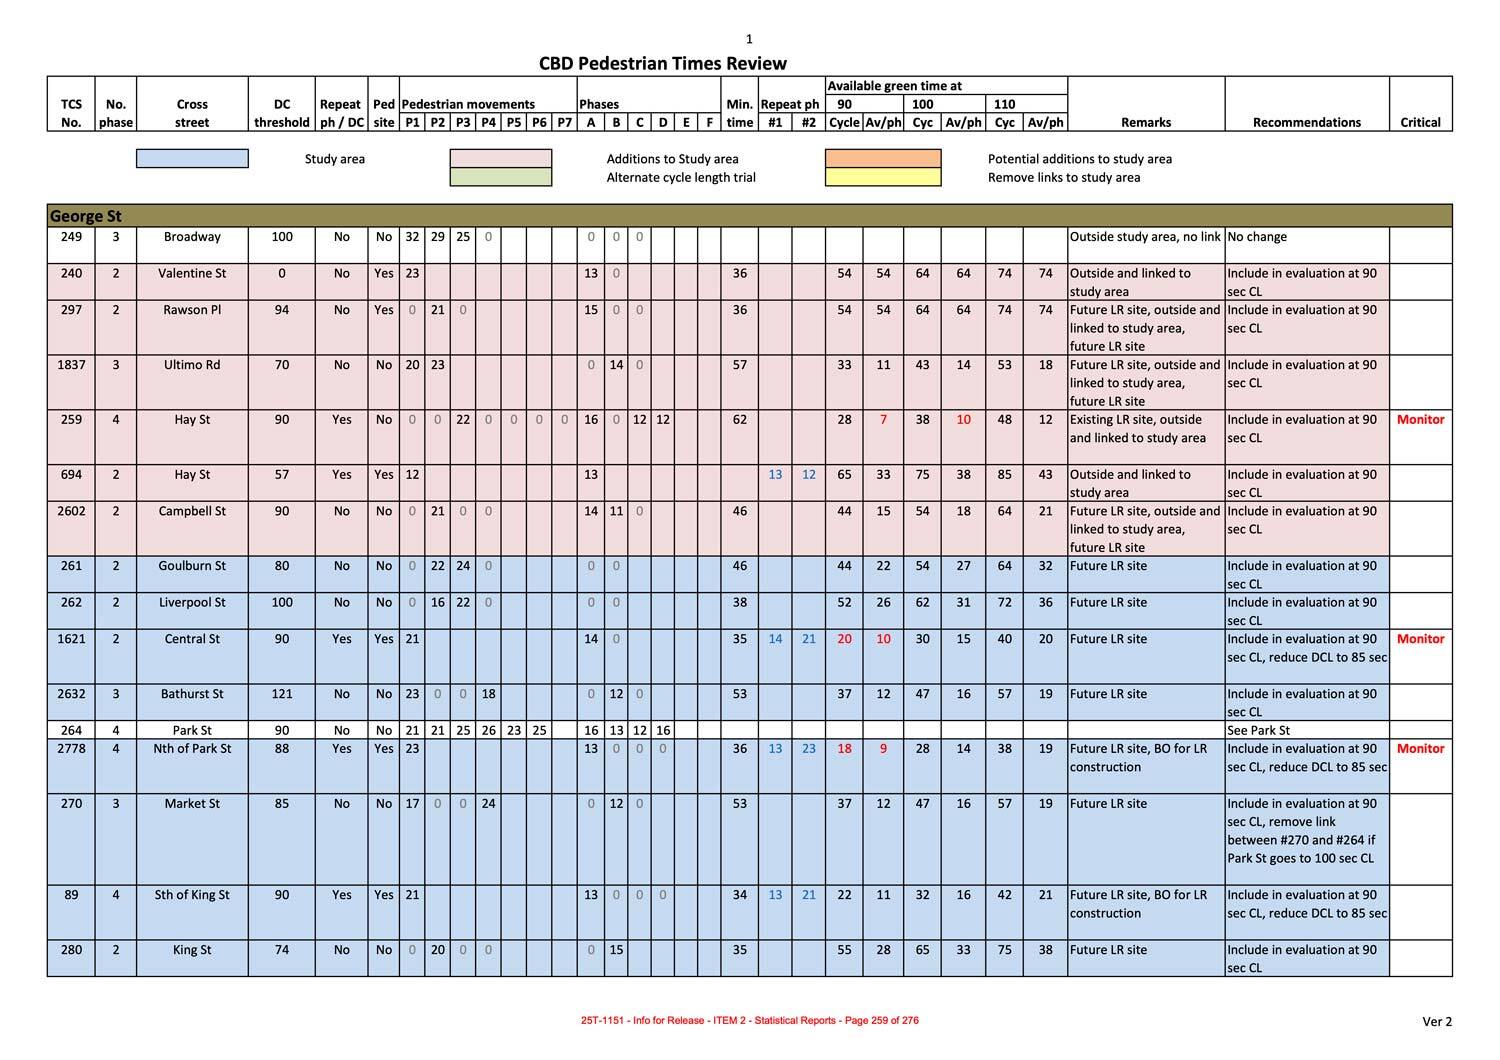 Above is a screenshot of a subset of the source data.[38] : 259
The minimum cycle time is not filled for all rows. These are likely outside the study area. We can’t calculate minimum cycle times by summing phase times if some are missing, however when all phase times are present, their sum equals the minimum cycle time specified. The value under “Available green time at” … “90” … “Cycle”, when subtracted from 90, equals the minimum cycle time specified (though note when intersections are double cycled).
Without intersection diagrams, it’s impossible to know which pedestrian phases run in parallel, and with which vehicle phases.. Note Victoria[42] and WA[43] publish such diagrams openly for every single signal, and Western Australian (WA) publishes actual (as run) phase timing for throughout the day in monthly GeoParquet data dumps[44], so the resultant cycle time (including min & max) can be estimated with a high degree of accuracy.
Data extraction
The tabular data in the GIPA result was not machine readable and not easily copied/exported into a structured spreadsheet for analysis. I have generated structured JSON data from this document [38]: 258–269 using LLM-powered OCR against a TypeScript interface. I have published the the code (and output) in a git repo – it may contain errors. PRs much appreciated!
Note there are some apparently incorrect dates in the daily report titles. On some documents it appears the day was updated but the month was not. See the README.md for details on this.
All JavaScript calculations for these charts are open, reproducible, and editable on the Observable notebook for your review or further analysis.[45]
See the appendix for Overpass Turbo queries utilised for this analysis.
Interpreted data
Results / graphs
This analysis suggests over 85% of signal sites have minimum cycle times less than sixty seconds, significantly lower than the current maximum cycle time of 90 seconds (excluding sites definitely changed since 2017).
This may have changed since, perhaps due to more protected phases which may increase minimum cycle times – but there is no open data, so it is impossible for the public to confirm.
Minimum cycle times for traffic signals in the Sydney CBD
Note: as discussed above, not all of these crossings are still present (see further charts guessing at which ones are no longer present).
Histogram of minimum signal cycle times in the Sydney CBD
What percentage of signals could run faster than 90 seconds?
This table shows what percentage of signals, of this potentially valid sample (i.e. signals in the study area, excluding George St, and excluding signals where TCS site IDs no longer exist in OSM), have a cycle time less than x seconds.
Map of minimum cycle times by status in the study area
Where have signals likely changed in design since the 2017 analysis?
How many signals in the study area could still be accurate?
There is currently no open dataset of post Nov-2017 signal timing data for the study area in the Sydney CBD, so we can not tell which signals have been physically redesigned or reprogrammed.
We can reasonably assume signals have likely been redesigned (but not confirm they haven’t been) when:
- The TCS site number no longer exists (i.e. the TCS site no longer exists in OpenStreetMap)
- the intersection is on George St, which has likely been changed as a result of the light rail
This chart visualises different signal groups. These groups attempt to infer which signal sites may still be present since the 2017 data. Of course, the only way to be sure of the current signal sites, their phasing and minimum duration – is to have more recent open data.
Key meaning:
- “On George St, but still in OSM”: A signal that is located on George St, and TCS site ID matches an existing relation in OpenStreetMap (OSM) – i.e. The TCS site still exists, but we the intersection has likely been redesigned.
- “Removed from OSM & on George St”: A signal that is located on George St, but the site ID is not in OSM – so likely has been removed (eg. completely removed signal sites)
- “Site in OSM & not on George St”: TCS site present in OSM, signal not on George Street. This indicates the signal is likely to still be present. Elsewhere in this report “potentially still remaining” or similar terminology refers to this subset.
- “Site removed from OSM, but not on George St”: TCS site id not in OSM, site not on George St. Signals have likely been removed.
Do mid-block / pedestrian only signals have a lower cycle time than intersections of two roads?
Yes – see the difference in distributions for pedestrian only intersections in the dataset.
Note there are still plenty of intersections of two roads with low minimum cycle times.
Which intersections have a minimum cycle time between 80 & 90 seconds?
Does the number of phases influence the minimum signal cycle time?
In theory, yes – more phases take more time to run.
How much available green time do signals have at 90s with current double cycling?
Note: This is a different distribution to the minimum cycle time chart, as an intersection that is currently double cycled will have a much smaller available green time than 90s minus the minimum cycle time.
Minimum cycle time for intersections to be double cycled
Double cycling means two pedestrian phases can be run in one cycle, reducing the pedestrian delay (think subdividing in musical terms).
Pedestrians are guaranteed to receive a green signal at least once per cycle for some of the Sydney CBD during daylight hours (automatic introduction), however this excludes specific state roads, the locations are which are publicly unknown.
Min time for double cycling is calculated using an unknown method and stored in the source document under DC Threshold (stored under the double_cycle_cycle_length_threshold key in this export).
Map of number of phases per signal
Map of “pedestrian sites” (eg. mid-block pedestrian crossings)
Analysis 2: Graphing qualitative congestion after CBD Cycle Time reductions
By week 8 (26 Feb – 2 Mar) of the signal cycle time reduction study, the only notes for the AM and PM peaks were that the “Network worked well”[4]: 4 . Every single prior week noted perceived (qualitative) traffic or congestion issues in both AM and PM peak periods. This suggests traffic evaporation, or the inverse of induced demand, occurred after 8 weeks.
This may be comparable to the duration following the opening of the Rozelle Interchange. A 2024-02-16 NSW Government press release[46] stated that “average travel time on Victoria Road between Lyons Road at Drummoyne and Anzac Bridge during the morning peak” had dropped from 62 minutes “the first week after Rozelle Interchange opened” (opening 2023-11-26, week after 2023-11-27 – 2023-12-01), to 30 minutes the week before this press release (2024-02-05 to 2024-02-09): a period of 10 weeks. Unfortunately the dashboard has since been hidden from public view – “Access denied” (HTTP 403) as opposed to “Page not found” (HTTP 404).
The difference between signal cycle times reductions and physical reallocation of road space is that cycle times are a continuous (and trivially revertable variable) rather than a (quite literally) set in concrete step function – and if SCATS has the technical software capability, could be changed slowly rather than as an immediate step function. Such adjustments are well known to software engineers as progressive rollouts as a technique to avoid disruption.
But can we graph this change in perceived congestion?
Method
Qualitative congestion data
Unfortunately, this analysis took place before connected-vehicle telematics data was more widely available. ITEM 2 DOC A[47]is titled “Traffic Volume” (same title in the Decision[48]), has a y-axis labelled “Traffic Volume” (seemingly a veh/hr scale), however it only includes data between 2018-01-08 and 2018-01-25 – it doesn’t include data before cycle times were changed. Traffic volumes in these graphs don’t visually appear to significantly increase or decrease, however less than one month of data was included. The source of traffic volume in this figure is unclear; I assume it is SCATS-derived (loop detector derived) volumes.
The only supplied material in the documents is daily qualitative observation reports, occasionally with photos from traffic cameras or Google Maps congestion colouring.
All input data is LLM OCRed (which may contain errors) of perceived qualitative perceived congestion. This is far from a rigorous analysis.
Scoring
To attempt to graph the change in perceived congestion through the trial from the daily qualitative observation reports, I wrote a simple function to map keywords to a score.
This code has been published as open-source. See the git repo and Observable notebook for futher reproduction, analysis and improvement.
The specific function for evaluating the score (as the critical code) is included in this blog post under the appendix heading below (as well as in the repo).
Results / graphs
AM+PM Summed Arbitrary Perceived Congestion values (daily)
AM+PM Summed Arbitrary Perceived Congestion values (weekly average)
AM, PM, AM+PM Summed Arbitrary Perceived Congestion values
Policy landscape and lack of transparency
2018 request to expand 90 second phasing
Eight months after the change, the City of Sydney Council unanimously resolved to ask the Roads Minister to expand “90 second signal phasing to the whole City of Sydney local government area”[2](motion by Philip Thalis, recent Australian Institute of Architects 2024 Gold Medallist). Clover Moore wrote to the Roads Minister (Melinda Pavey) to request a broader rollout on the 8th of November 2018[9] (as discussed in the media[49][16]), but the Sydney Morning Herald reported on the 19th that “A spokesman for Ms Pavey declined to comment, saying the minister’s office had not yet received the lord mayor’s letter.”[16] I am not aware of a reply to this letter or any TfNSW consideration of a broader rollout in the City of Sydney.
The 2018 Transport for NSW Road Safety Progress report (under the “Pedestrian safety” section) even counted “Six hundred Look Out Before you Step Out pavement vinyls were installed across Sydney”, but didn’t have a single mention of this signal timing change.[50]
I am not aware of an official record identifying other 90-second timing areas elsewhere in NSW. Advocates have been told of a few locations in meetings[51]: 2 , though validating this is impossible as data on signal timing is not published.[39] Advocates have resorted to crowdsourcing signal timing, spearheaded by yours truly.[52] Wouldn’t you like to know if intersections on your local high street, or next to your children’s school, or outside your nearest hospital, have been made safer – and if not, why?
Government policy states TfNSW must “document road user space trade-off decisions, providing evidence and reasons”, and to “adhere to these principles ahead of any guidance that seeks to protect or maintain private vehicle level of service.”[23] Signal timing data is not published in NSW. As discussed in my prior analyses, [53][54][37][55][39] access to traffic signal data is prohibitively expensive ($200 per intersection[56]), for seemingly no logical reason. Other states demonstrate that publishing phase/timing data openly is feasible (“There is nothing particularly tricky happening here”[51]: 3 – WA Network Operations Analysis Manager, personal correspondence, 2025-06-06)
Temporal allocation is too important to be hidden from the public, however the December 2023 implementation review of the Road User Space Allocation Policy noted that “…temporal considerations of road space allocation are rarely discussed in the road space allocation conversation.” Finding 4.11 a) was “Our current tools and processes focus on measuring vehicle movements, and benefits such as travel time savings and safety, making it difficult to fairly assess trade-offs”, and 4.11 b) was “There was a reported lack of maturity in tools to trade-off or quantify impacts of changes to road space allocation for non-car modes”[21]
Transparency and accountability are cornerstones of good governance. Without access to data, the public cannot learn whether outcomes are improving. This is government data – taxpayers have already paid for the infrastructure and expertise that generates this data.
Formal requests for open signal phasing data
In April 2025, I wrote to TfNSW on behalf of WalkSydney (co-signed by the Presidents of WalkSydney and Better Streets) requesting publication of signal-timing data.[57] After two[58] responses[59] declining release (with factual errors we addressed in reply[60]), we met with TfNSW officers (who did not have authority to release the data).
Concerns were raised about releasing “raw” data and about complaint risk. We reiterated our view that “transparent access to data assists and is critical for citizens to understand how the Government is implementing its policies eg: TfNSW Movement & Place policy”, and that prioritisation debates should be resolved by policy, not by making changes behind closed doors.
In a subsequent letter to the we requested data for just one weekday[51].
We received a response from the Coordinator-General of Transport for NSW (Howard Collins) that “…Transport for NSW does not publish the SCATS Signal Phasing data you requested and currently has no plans to make this information publicly available.”[40]
This correspondence has been described on the WalkSydney blog.[61]
Current TfNSW initiatives to enhance pedestrian environments and improve signal priority for people walking
This response[40] outlined work-in-progress efforts to improve pedestrian priority at signals, though some have limited public visibility into their progress or data on their outcomes:
- Trial site in Manly using video density detection to dynamically extend the Green Pedestrian Symbol,
- I hope a public outcomes report is published at the conclusion of the trial. No public data of the extension in green interval amid large crowds is currently published. Keep an eye on Better Intersections at the site. I have so far measured an extension of only 3 seconds after a ferry arrived, though this was off-peak.
- 2025-10-19 edit: By detecting how many people are waiting and and prompting “longer or more frequent green signals for pedestrians”, this trial has found “in terms of safety outcomes, we’ve already seen that that’s made a 34% decrease in risky crossing behaviour.” It is the first time pedestrian measures have been used within the SCATS network to influence signal phasing.[62][63] This is an incredible result. It begs the question: what would be the safety benefit across Sydney if pedestrian signals were given longer crossing times or shorter wait (cycle) times with similar ambition to this 2018 trial?
- The Manly trial “technology would have little applicability in the CBD or areas where the maximum cycle time is very close to the minimal safety signal times permitted”[64], however this analysis page casts doubt on the claim that CBD cycle times cannot be reduced below 90 seconds. In any case, there are plenty of intersections across Sydney where additional time could be given to pedestrians without waiting for camera technology – the unstated assumption of this trial is to prioritise vehicle level of service over pedestrians when the number of pedestrians is not deemed significant (above an unpublished threshold) or where such a camera is not present: “…But it adapts back; if there’s nobody waiting, it goes back to a normal walk time, which then allows the vehicular traffic to go through.”[63]
- Sharing phasing data – as is clearly possible (“We also have a product that provides the signal phase and timing of each individual intersection and broadcasts it”[63]) but has been apparently been delayed for commercial reasons (“So we’ve got the way to do it now, the business model and how to do it is a different question”[63]) – would clear up this doubt on what can or can’t be done.
- While one expressed view is that reselling phasing data through brokers may be faster (“…I think it absolutely makes sense that there’s one source of data, but I think there are commercial imperatives that might make, that might be faster. I don’t want to cast any aspersions on the speed with which traffic authorities move”[63]), WA Main Roads released over 8GB of signal data in GeoParquet format an impressive 76 days after deciding to do so.[60]: 6 [39] I have no doubt in the technical ability of our road agencies, such ability has been acknowledged since the 70s: “the Department of Main Roads, for example (and it is typical of many others) are exceptionally well-equipped to analyze the engineering aspects of any problem”.[65]: 35 Planning decisions “…are not simply technical decisions but have environmental, social and redistributive effects which require not only technical and engineering analysis but also the broader type of policy analysis…” (1978)[65]: 34 , a sentiment which still echos today[21]: 7 .
- The Committee for Sydney also published a report on the critical role longer crossing times has for older people, carers with prams, and anyone moving with reduced mobility.[66]
- Pedestrian Protection Mass Action Program to reduce conflicts between turning vehicles and pedestrians at signalised intersections,
- The 2023 Summary Report on the program is much appreciated, and highlights some impressive improved safety outcomes.[67] (I was previously unaware of some the useful information in this report and regret not including this earlier). There is no public information about the timeline of this program, where pedestrian protection is missing, and where they will be installed in future. I am unsure if/when unprotected pedestrian crossings with long green durations (as common in Copenhagen, Paris) are/become unsafe (eg. 85th percentile speed, vehicle volumes?)
- Ongoing review and optimisation of signal timings to minimise pedestrian wait times where feasible, and
- There is no public data on when, where, how often, or the outcome of how signal timings are adjusted. There is a widely held scepticism in advocacy circles that many signals are being reviewed. In contrast, Transport for London undertakes “annual timing reviews at 1,200 signal junctions and crossings”, with reducing pedestrian wait times a (measured) objective since 2018 (7 years ago). In 2017, “TfL reduced the wait times for people walking at 200 crossing locations close to schools, hospitals and transport hubs”, published a map of the locations of these intersections, and “over 94 per cent now run a cycle time of less than one minute”, with a maximum wait time of “40 seconds or less”.[68]
- Installation of over 30 missing marked pedestrian crossings at signalised intersections in the past two years.
An Auckland traffic engineer documented in 2022 that SCATS does not natively show pedestrian delay. “data can be viewed in the Event log in SCATS history but it requires exporting and manipulation to get any usable data”.[71]
Community interest and safety context
Frustration with long pedestrian waits is well-documented. The public[55][72][73][74][75][76][77], a wide range of good-governance groups[78][26][79] [80] , media[16][81][49], councils[82][83][84][85][86], urban strategy firms[87]and evidence-based urban policy think tanks[88] are calling for improvements.
The latest road safety data is a disaster: As of 2025-09-23, pedestrian fatalities are rising 27% year on year in NSW[10] (rising over three times faster than car driver fatalities). More people walking are killed in the City of Sydney than any other LGA in NSW[11]: 6 , but the council has no power to reduce speed limits or change signal operation.[11]: 19
In 2018 SMH reported “Transport for NSW previously said the shorter 90-second wait times had kept pedestrians moving and could potentially reduce the risk of jaywalking and pedestrian crashes.”[16] A direct TfNSW spokesperson quote of “Shorter wait times have kept pedestrians moving and could potentially reduce the risk of jaywalking and pedestrian crashes” was published in 2019.[17]
Against the direction of world cities, TfNSW (with direction from Chris Minns[89]) has refused requests from councils to allow reduction of speed limits to 30km/h on local roads. Under the previous executive director Katherine O’Regan, Business Sydney described the benefits in 2020: “At 30 the amenity killing noise finally becomes acceptable for outdoor dining, public space activation and encourages people spurs economic activity by encouraging people to linger longer to enjoy what the Street has to offer.”[90]
The NSW Government 3 Star AusRAP target has been achieved or exceeded on all streets in the City of Sydney, yet people walking and riding are still being killed and injured. More people walking are killed in the City of Sydney than any other LGA in NSW. The City of Sydney is unable to change speed limits – the City of Sydney is advocating for TfNSW to set 40km/h on state roads in the local government area.[11]
Economic analysis indicates that pedestrian signal delay has significant costs. One study estimated that a 10% increase in pedestrian delays in central Melbourne would impose approximately $2.1 billion in additional time costs — about a 6.6% reduction in CBD economic output.[91][92]
Sydney Metro Conditions of Approval relation to traffic signals
Note that Sydney Metro Condition of Approval D12[93] Block 1 – 4 data includes minimum actual cycle times during AM & PM weekday peaks and weekend peaks, however these periods are likely run close to the maximum cycle time. Signal data as part of these reports is not currently public. This requirement was interpreted in the Block 1 Report[94] as measuring and preserving the vehicle Level of Service metric at nearby intersections at the expense of other modes (which, if you are a keen observer, is against the guideance of the RUSAP[23]), several of which are within the study area (CBD). Both reports contain nominal cycle times supplied for SIDRA modelling at intersections outside metro stations. Pedestrian Movement Performance levels of service output by SIDRA modelling are not discussed or included in the evaluation of intersection performance.
Advocates should be aware of Sydney Metro West CoA E126 and E124[95] and how they may interact.
US Automated Signal Performance Metrics (ATSPMs)
A transcript of the Q&A discussion[96] after a presentation hosted by The Eastern Transportation Coalition contains some great insights into the benefit of public traffic signal data and performance metrics based on such data.
The 2022 presentation was titled “Everything You’ve Ever Wanted To Know About ATSPMs: Harnessing The Power Of Automated Signal Performance Metrics For Your Agency”[97].
Q: Jeremy Borden (Alabama DOT): What is the benefit of sharing ATSPMs [Automated Signal Performance Metrics] with the public? Seems like it invites a lot of unnecessary discussions and public signal experts.
A: Mark Taylor (Utah DOT): One of the things that we are always reminded of by our director at UDOT is we are working for the public. Our revenue in government is how much the public trusts us. We try to be as transparent as we can and if there’s any data that’s not personal, we give it to the public.
A: Joanna Bush (Mead and Hunt): It’s a time saver. As a public agency, it’s your responsibility to provide this information if the public asks for it. Our signal engineers would spend a lot of time packaging crash information at signalized intersections. Instead, you can point the public to one place to get information. As Kelly said, in the end, everybody benefits from it. You’re getting free services. Somebody is looking at your efficiencies without you having to spend time analyzing them.
FAQs
Note: many signal-related FAQs are answered on my blog post “Shining a Light on the Traffic Signals of Sydney”.[37]
Why did TfNSW take the initiative to reduce cycle times?
I don’t know! None of the documents reference the light rail installation, so it doesn’t appear to be related to that.
In 2007, the public spaces and public life study by Gehl Architects included that the second highest problem in the pedestrian landscape was “Unacceptable long waiting times at intersections”. Problem #3 was “Push buttons at every intersection” and problem #4 “Unacceptable short periods for crossing streets”[98]
The TfNSW Sydney City Centre Access Strategy (2013)[99] includes “…there will be reduced waiting times for pedestrians at traffic lights”[99]: 3 and a “Key Consideration” is that “Minimising signal cycle times at intersections by simplifying intersections in terms of the turning movement required”: 28
In 2014, Alex Greenwich moved a motion that the Sydney City Centre Access Strategy is supported, and priority is given to pedestrians, including that he supports pedestrian improvements including “reducing waiting times at traffic lights”.[100]
The TfNSW Movement & Place framework and Road User Space Allocation Policy didn’t exist in late 2017, so there was no specific policy recommending temporal street space is reallocated for pedestrians.
A TfNSW spokesperson stated in a 2018 SMH article that “Shorter wait times have kept pedestrians moving and could potentially reduce the risk of jaywalking and pedestrian crashes”[101].
Transport for NSW’s coordinator-general, Marg Prendergast stated in a 2018 Guardian article that “The wait times were reduced to keep pedestrians moving and help reduce the risk of jaywalking and pedestrian crashes”[81]
In 2020 Gehl Architects included this in their 2020 Public Space & Public Life Study:[87]: 142
The reduction in waiting times has improved pedestrian amenity, however further improvements can be made. … Transport NSW have reduced pedestrian signal cycle time from 110 seconds to 90 seconds enabling more frequent crossing opportunities for pedestrians. Further changes will be explored after light rail becomes operational to ascertain further efficiencies.
Philip Thalis’ 2018 motion in the City of Sydney council mentioned “research by Transport for NSW in 2011 showed that pedestrians wait on average 50 per cent longer than motor vehicles at intersections in the city centre”[2]. Clover Moore’s letter mirrored the requests in this motion.[9]
See the Timeline section below for a brief timeline of events.
Sydney City Centre Capacity Improvement Project
The 2017 briefing note to “To inform both Ministers of a planned evaluation of improved pedestrian” stated:[102]
Since 2014, Transport Coordination and Roads and Maritime have worked to deliver a number of initiatives to improve traffic flow within the core of the Sydney CBD, which has included:
- Tomorrows Sydney Campaign.
- Travel Choices (Travel Demand Management).
- Sydney City Centre Capacity Improvement project – Improve traffic flow on the outer perimeter of the CBD to prioritise the CBD core for pedestrians and public transport.
Over that period, there has been a continued reduction in private vehicle trips entering the CBD core in the morning peak period, which has improved traffic flow in the Sydney CBD and has enabled the proposed reduction in traffic signal cycle times.
The ‘Sydney City Centre Capacity Improvement project[103][104] was particularly contentious. It was explicitly designed to increase road capacity for private vehicles (in the title).
It planned to “achieve equivalent throughput” at east-west signalised intersections, to create additional north-south capacity, with “The primary objective of schemes proposed is to provide additional intersection capacity”, discussing traffic signals only in the context of maintaining private vehicle capacity.[104]: 76
In a remarkably enlightening statement, it claims “The reduction in demand within the city centre would be negated by the reduction in capacity”[104]: 72 – which forgets to mention the reason for (vehicle) demand reduction. The overwhelming evidence is that reduction in road capacity causes the reduction in demand.[6][105]
How did you find out about this 3-month study?
I found this interesting footnote in an NRMA document[106].
Reducing the waiting time for pedestrians to cross at a signalised intersections can help to reduce the risk of jaywalking and pedestrian crashes, with minimal impact on traffic congestion. From 7 January 2018, Transport for NSW with the Roads and Maritime Services introduced 90 second pedestrian cycle times across the Sydney CBD. Monitoring was undertaken for a three month period to assess impacts across the network and the wait time was tweaked for certain streets. The change in cycle times has reduced waiting times for pedestrians at signals, meaning more frequent safe crossing opportunities.14
Footnote 14 is referenced as “Transport for NSW (2019). Personal correspondence”. The GIPA[a] officer was not able to find this correspondence[48]: 5
Note: This report unproductively focuses on victim-blaming ‘distracted’ pedestrians for the continued increase in fatalities due to car drivers killing people walking, which is still increasing this year. Research from the NYC Department of Transportation found “little concrete evidence that device-induced distracted walking contributes significantly to pedestrian fatalities and injuries”[107]
Timeline
- 2006-02: TfL: Factors Influencing Pedestrian Safety Literature Review (> 30 seconds waits hazardous)[12]
- 2007: Gehl Architects: Public Spaces and Public Life Study, with recomendations for reducing wait times[98]
- 2011-04: NZ Transport Agency: Reducing pedestrian delay at traffic signals report[13]
- 2014-03-27: Alex Greenwich: motion to reduce wait times at traffic lights[100]
- 2014-11: TfNSW: Sydney City Centre Capacity Improvement Plan Review of Environmental Factors[103]
- 2017-11-24: TfNSW: CBD Pedestrian Times Review[38]
- 2017-11-29: TfNSW: Map of CBD area for cycle time evaluation[35]
- 2018-01-07: TfNSW: Sydney CBD cycle times reduced from 110 to 90 seconds[102]
- 2018-09-17: CoS: Thalis motion to reduce wait times at traffic lights across council area[2]
- 2018-11-08: Clover Moore, Lord Mayor of Sydney: “Optimising Pedestrian Movement in Central Sydney”[9]
- 2018-11-19: SMH: Quote: “the minister’s office had not yet received the lord mayor’s letter”[16]
- 2018: TfNSW: Road Safety Progress Report does not mention cycle time reduction program[50]
- 2019: SMH: Oslo achieves 0 pedestrian and cyclist road deaths[31]
- 2020: Gehl Architects: Second City of Sydney Public Space and Public Life Study, with recomendations that more can be done on wait times[87]
- 2021: TfNSW: RUSAP introduced[21]
- 2022-12-19: Jake Coppinger: Blog post on “beg buttons”
- 2023-06-12: Jake Coppinger: Blog post on measuring pedestrian wait times with Better Intersections[54]
- 2023-07-10: Jake Coppinger: Blog post on “Shining a Light on the Traffic Signals of Sydney”[37]
- 2023-12: TfNSW: RUSAP Implementation Review Report[21]
- 2024-06: Updated (strengthened) RUSAP[23]
- 2024-11: CfS: “Walkable and bikeable streets are good for business” factsheet[19]
- 2025-08-02: Politico: Helsinki achieves Vision Zero, with 0 traffic fatalities[33]
- 2025: Josef Whitfield: “Pedestrian Wait-Time Reduction: A Vast Improvement to the Pedestrian Experience on a Shoestring Budget” wins ‘Best Paper at the Conference’ at 2025TPM[18]
- 2026: TfNSW: Roads Act 1993 Review carried out until 2026[21]
Appendix
Documents
I personally paid $441 to obtain and release these documents. If you find them useful, please let me know!
- GIPA[a] Correspondence
- Documents released:
- ITEM 1 – Briefing Notes: (25T-1151 ITEM 1 – Briefing notes_Redacted.pdf[112]), containing:
- 25T-1151 ITEM 2 – Statistical reports.pdf[1]
- 25T-1151 ITEM 2 – Statistical Reports – Brodie BOAM February 2017.xlsm[116]
- 2017 Bus Opal Assignment Model data
- 25T-1151 ITEM 2 – Statistical Reports – Brodie BOAM February 2018.xlsx[117]
- 2018 Bus Opal Assignment Model data
- ITEM 3 – Presentations: 25T-1151 ITEM 3 – Presentations.pdf[4]
- ITEM 4 – Email correspondence: 25T-1151 ITEM 4 – Emails_Redacted.pdf[118], containing:
- BATCH A – Traffic reports discussing 90 second trial
- BATCH B – 90 second impacts correspondence and attachment
- BATCH C – 100 second locations
- ITEM 5 – Email correspondence with NRMA: “Not held”
- ITEM 6 – Meeting Minutes: “Not held”
- ITEM 7: Daily Summary Reports: 25T-1151 ITEM 7 – Daily Summary Reports.pdf[119]
Analysis 1 Appendix
Overpass Turbo queries utilised
- Signals query: https://overpass-turbo.eu/s/1OF5
- CoS relation: https://overpass-turbo.eu/s/1OF8
- Ways: https://overpass-turbo.eu/s/1OF7
- CoS CBD ways: https://overpass-turbo.eu/s/289A
- Sydney CBD relation query: https://overpass-turbo.eu/s/289y
If you want to find the coordinates of a TCS signal ID, this is the query you need: https://overpass-turbo.eu/s/2bRJ
Thanks very much to the OSM contributors importing traffic_signal site refs and start_date‘s – I couldn’t have done this without you!
OpenStreetMap intersections missing ref values
Most OSM site=traffic_signals relations in the City of Sydney have a ref attribute, so they can be matched against this dataset, but this is not guaranteed.
In such cases, the dataset we plot on maps (as lat and lon come from OSM data) doesn’t necessarily contain all sites from the TfNSW signal audit.
Use this Overpass query to identify and fix these sites missing a ref: https://overpass-turbo.eu/s/289G. Use this Overpass query to identify and fix potential signal sites, that don’t have a site=traffic_signals: https://overpass-turbo.eu/s/289I
I have looked through all the sites in the survey area and they all appear to be complete. Therefore sites missing lat (i.e. an OSM attribute decorated/added in the “join”) have likely been removed from OSM.
Analysis 2 Appendix
Scoring function
I whipped this analysis piece up quickly – it’s not my best work or production code!
The scores themselves are arbitrary; and so is this keyword analysis, but I found it interesting to see the change over the trial.
Further interesting work on this topic could include evaluating descriptors against Austroads Level of Service (LoS) descriptors, however I think it would be more worthwhile to undertake quantitative analysis of the bus data.
See the git repo for the full code. As this is the ‘critical path’ I thought I’d also include it here.
export function inferCongestionFromReport(descriptor: string | undefined):
  number | undefined {
  // If no note has been made, consider there to be no congestion.
  if (descriptor === undefined) {
    return 0;
  }
  const text = descriptor.replace(/\n/g, ' ').toLowerCase().trim();
  const ratings: number[] = [];

  const zeroRatingStrings = [
    'no issue',
    'no issues',
    'lighter than usual',
  ];

  const oneRatingStrings = [
    'some delays',
    'no major issues',
    'no major concerns',
    'usual congestion',
    'reasonable performance',
    'traffic significantly lighter',
    'noticeably lighter',
    'significantly lighter than previous',
    'intermittently queuing',
    'not as busy as previous',
  ];
  const twoRatingStrings = [
    'some queuing',
    'queues were observed',
    'some delays experienced',
    'some local congestion',
    'reasonable congestion',
    'generally observed to be clearing the intersections',
    'slightly heavier',
    'heavier than previous weeks',
    'some congestion',
  ];
  const threeRatingStrings = [
    'appeared heavier',
    'noticeably heavier',
    'general traffic was also queued',
    'noticeably heavier than previous',
    'reasonably heavy',
    'generally heavy',
    'heavy congestion although not as bad',
    'heavy but flowing',
  ];

  const fourRatingStrings = [
    'heavy traffic',
    'heavy general traffic',
    'heavy congestion',
    'congestion very heavy',
    'severe congestion',
  ];

  /** Used only if no matches found in the above mappings */
  const ifNoMatchesMappings: { key: string, value: number }[] = [
    { key: 'very heavy', value: 4 },
    { key: 'queuing', value: 2 },
    { key: 'heavy', value: 3 },
    { key: 'congested', value: 1 },
    { key: 'congestion', value: 1 },
    { key: 'busy', value: 1 },
  ];

  if (text === '' || zeroRatingStrings.some(str => text.includes(str))) { ratings.push(0); }
  if (oneRatingStrings.some(str => text.includes(str))) { ratings.push(1); }
  if (twoRatingStrings.some(str => text.includes(str))) { ratings.push(2); }
  if (threeRatingStrings.some(str => text.includes(str))) { ratings.push(3); }
  if (fourRatingStrings.some(str => text.includes(str))) { ratings.push(4); }

  if (ratings.length === 0) {
    for (const { key, value } of ifNoMatchesMappings) {
      if (text.includes(key)) {
        ratings.push(value);
        // Only use the first match - we don't want to double count based on single words that aren't
        // highly specific.
        break;
      }
    }
  }

  if (ratings.length !== 0) {
    if (ratings.length !== 1) {
      // console.warn(`Multiple ratings (${ratings.join(', ')}, using 1st) for: ${descriptor})`);
    }
    return ratings[0];
  }
  if (!descriptorReport[text]) {
    descriptorReport[text] = ratings[0];
  }
  return undefined;
}
Meta notes on my drafting process
I welcome any feedback on this blog post format, or any corrections or constructive criticism, as always!
Drafting in Wikitext
I’ve tried out drafting this blog post in Wikitext as I greatly appreciate Wikipedia-style citations. I’d usually draft in Markdown (for source control) and then export to WordPress for finalising formatting working with images (I’ve previously run my own blog templating engine with a custom srcset generation implementation, it was not fun!).
At first I wrote an HTML transformer (operating on a virtual DOM using JSDOM) to remove some Mediawiki-specific elements.
As WordPress strips li id‘s on paste (and strips paragraph elements if they are the only child of a list element) I “rendered” the ordered list elements to actual paragraphs with numbers in them (moving list id‘s to the corresponding paragraph for citation anchor links). I found that WordPress HTML sterilisation still ran on superscript element id‘s, and raw HTML blocks are only available as block elements (forcing in-text citations onto their own lines), so I resorted to using one HTML block for the entire page. I’m still using JSDOM transformation for some minor tweaks, such as removing [ edit | edit source ] from titles.
I added few tiny CSS/JS snippets for Wikipedia-style citations-on-hover to my WordPress installation, showing a tooltip at the bottom of screen on mobile on click. Please email me if you notice any usability issues on your device/browser in this functionality.
I was initially drafting in the Wikipedia sandbox but I wanted to enable the `$wgRawHtml` setting to enable embedding the iframe tags for the Observable chart embeds (I didn’t want to have to copy them in one-by-one (or copy text around them) for updates). I ended up spinning up a local Mediawiki instance to draft in. Let me know if you’d like a copy of my LocalSettings.php to get this running, along with the minimal list of Template: and Module: pages I had to export/import to get inline citations running.
If anyone has been tinkering on rendering Wikitext citations in the sidebar or has other ideas for better Wikitext citation rendering, I’d love to chat! I’m on Mastodon at @[email protected].
Text fragment hyperlinks
In many cases I’ve hyperlinked with #page=NUMBER or #:~:text=QUOTE affixed so that clicking on the link takes the user to the exact page or paragraph, except when a reference is reused by multiple mentions, in which I use : PAGE_NUM . This functionality is currently only supported in some browsers (https://caniuse.com/url-scroll-to-text-fragment), and is described in this draft W3C Draft Community Group Report. Urls will load normally in all browsers.
Footnotes
References
- ↑ 1.0 1.1 Transport for NSW (2025-06-04). “25T-1151 – Info for Release – ITEM 2 – Statistical Reports (276 pages)” (PDF).
- ↑ 2.0 2.1 2.2 2.3 City of Sydney Council (2018-09-17). “City of Sydney Council Minutes – 2018-09-17 – Pedestrian Signals motion (Philip Thalis)” (PDF). Archived (PDF) from the original on 2019-03-30.
- ↑ 3.0 3.1 3.2 Transport for NSW. ““Improved pedestrian accessibility in the CBD”, Briefing: Minister for Transport and Infrastructure, Minister for Roads, Maritime and Freight, FOR INFORMATION” (PDF). p. 7.
- ↑ 4.0 4.1 4.2 4.3 4.4 4.5 4.6 Transport for NSW. “25T-1151 – ITEM 3 – Info for Release – Presentation” (PDF).
- ↑ 5.0 5.1 Transport for NSW. “Doc B – Bus Travel times” (PDF). p. 273.
- ↑ 6.0 6.1 Cairns, Sally; Hass-Klau, Carmen & Goodwin, Phil (1998). Traffic Impact of Highway Capacity Reductions: Assessment of the Evidence (PDF). London: Landor Publishing. ISBN 1-899650-10-5. Archived from the original (PDF) on 2017-01-17.
- ↑ Downs, Anthony (July 1962). “The law of peak-hour expressway congestion”. Traffic Quarterly. 16 (3): 393–409. hdl:2027/uc1.$b3477.
- ↑ Downs, Anthony (1992). Stuck in traffic: Coping with peak-hour traffic congestion. Brookings Institution Press. ISBN 9780815719236.
- ↑ 9.0 9.1 9.2 9.3 Clover Moore, Lord Mayor of Sydney (2018-11-08). “Optimising Pedestrian Movement in Central Sydney” (PDF). Letter to The Hon. Melinda Pavey MP, Minister for Roads, Maritime and Freight.
- ↑ 10.0 10.1 “Road Fatalities for NSW up to and including Monday, 22 September 2025: 12-MONTH PERIOD ENDING 22 September (2025 vs 2024) (Prelim)” (PDF). Transport for NSW. p. 3. Archived from the original (PDF) on 2025-09-23.
- ↑ 11.0 11.1 11.2 11.3 11.4 11.5 City of Sydney (2025-08-19). “Safe Speeds: The role of speed reduction and lower speed limits in reducing road trauma” (PDF). AITPM.
- ↑ 12.0 12.1 A Martin (TRL Limited) (February 2006). “FACTORS INFLUENCING PEDESTRIAN SAFETY: A LITERATURE REVIEW” (PDF). London Road Safety Unit, Transport for London. Archived (PDF) from the original on 2016-06-15.
- ↑ 13.0 13.1 C Vallyon,; S Turner (April 2011). “Reducing pedestrian delay at traffic signals (NZTA research report 440)” (PDF). NZ Transport Agency. Archived (PDF) from the original on 2015-09-08.
- ↑ Baass K G (1989). “Review of European and North American practice of pedestrian signal timing”. Transportation Association of Canada (TAC). ISBN 1-895102-10-3.
- ↑ Stefan Bussey (2018). “Reducing Pedestrian Delay at Half Signals in the City of Portland, OR: Striving to increase safety and decrease delay for pedestrian trips” (PDF). City of Portland Oregon, City of Portland Bureau of Transportation, Oregon Transportation Research and Education Consortium (OTREC). Archived (PDF) from the original on 2020-04-19.
- ↑ 16.0 16.1 16.2 16.3 16.4 16.5 Megan Gorrey (2018-11-19). “Two minutes too long before crossing? Push to shorten pedestrian wait”. The Sydney Morning Herald. Archived from the original on 2022-01-25.
- ↑ 17.0 17.1 Andrew Taylor (2019-05-19). “Shorter wait times, diagonal crossings, more footpaths: How to ease Sydney’s pedestrian congestion”. Sydney Morning Herald. Archived from the original on 2021-12-05.
- ↑ 18.0 18.1 Josef Whitfield (2025). Pedestrian Wait-Time Reduction: A Vast Improvement to the Pedestrian Experience on a Shoestring Budget. Transport Planning and Modelling (TPM) Conference. Transport for Greater Manchester (TfGM). Archived from the original on 2025-09-25.
- ↑ 19.0 19.1 Committee for Sydney, AECOM (November 2024). “Walkable and bikeable streets are good for business” (PDF). Archived (PDF) from the original on 2025-08-05.
- ↑ “Tech Central Economic Development Strategy”. NSW Government – Premier’s Department. September 2025. Archived from the original on 2025-09-25.
- ↑ 21.0 21.1 21.2 21.3 21.4 21.5 21.6 Transport for NSW (December 2023). “Road User Space Allocation Policy Implementation Review Report” (PDF). Archived (PDF) from the original on 2025-09-11.
- ↑ Lord Mayor Clover Moore (2024-04-08). “2024 Australian Urban Design Awards (Minute by the Lord Mayor)”. City of Sydney. Archived from the original on 2025-04-30.
- ↑ 23.0 23.1 23.2 23.3 Transport for NSW (July 2024). “Road User Space Allocation Policy” (PDF). Archived (PDF) from the original on 2024-07-25.
- ↑ “Roads Act 1993 Review”. Transport for NSW. 2025-09-15. Archived from the original on 2025-09-25.
- ↑ “Roads Act 1993 Issues Paper Committee for Sydney submission” (PDF). Committee for Sydney. April 2025. p. 10. Archived (PDF) from the original on 2025-09-24.
- ↑ 26.0 26.1 WalkSydney & Better Streets. “Roads Act Review Submission” (PDF). p. 13. Archived (PDF) from the original on 2025-09-25.
- ↑ Sarah Bickford; Peter McLean (2025-03-25). “Re: Roads Act Review Issues Paper” (PDF). Letter to Ben Cebuliak (Manager Movement and Place). Bicycle NSW. p. 7.
- ↑ Warren Salomon. “Re: Review of the 1993 NSW Roads Act” (PDF). Letter to Transport for NSW. BIKEast. Archived (PDF) from the original on 2025-09-25.
- ↑ Dr Christopher Standen (2025-03-25). “Personal submission on Roads Act 1993 – Issues Paper Review” (PDF). p. 1. Archived (PDF) from the original on 2025-09-25.
- ↑ Sydney Coordinated Adaptive Traffic System (SCATS), New South Wales. “SCATS Evolution” (PDF). p. 3. Archived (PDF) from the original on 2025-09-24.
- ↑ 31.0 31.1 Julie Power (2020-01-13). “Oslo cut road deaths to one in 2019. Can Sydney do the same?”. Sydney Morning Herald. Archived from the original on 2024-06-15.
- ↑ Jake Coppinger. “Better Intersections, Oslo”.
- ↑ 33.0 33.1 Aitor Hernández-Morales (2025-08-02). “Helsinki just went a full year without a single traffic death”. Politico. Archived from the original on 2025-09-13.
- ↑ 34.0 34.1 Manisha Prakash (2025-02-03). “Your application under the Government Information (Public Access) Act 2009 (GIPA Act) (25T-1151 Ack)” (PDF). Letter to Jake Coppinger. Transport for NSW.
- ↑ 35.0 35.1 “Map of original CBD area for evaluation (attachment A) (CCO_0604/004/29NOV17), from “Improved pedestrian accessibility in the CBD””, Briefing for Minister for Transport and Infrastructure & Minister for Roads, Maritime and Freight” (PDF). Transport for NSW. 2017-11-29. p. 11.
- ↑ Transport for NSW (2018-04-05). “CBD Signal Phasing Times, CCO_604/005/05APR18” (PDF).
- ↑ 37.0 37.1 37.2 37.3 Jake Coppinger (2023-07-10). “Shining a Light on the Traffic Signals of Sydney”.
- ↑ 38.0 38.1 38.2 38.3 38.4 Denis Wood (Senior Traffic Network Manager) (2017-11-24). “CBD pedestrian times & CBD Pedestrian Times Review (DOC H – Pedestrian times Summary & Assessment)” (PDF). Transport for NSW. p. 256.
- ↑ 39.0 39.1 39.2 39.3 Jake Coppinger (2025-05-15). “No Signal for Pedestrian Safety: TfNSW Refuses Signal Data During National Road Safety Week”.
- ↑ 40.0 40.1 40.2 Howard Collins (2025-08-25). “Re: Request for Public Access of SCATS Signal Phasing Data across one weekday for all NSW signals” (PDF). Letter to Jake Coppinger. Transport for NSW.
- ↑ Better Streets (2025-08-30). “Transport Camp Sydney 2025”. Archived from the original on 2025-09-25.
- ↑ “Traffic Signal Configuration Data Sheets (Creative Commons Attribution 4.0 International)”. Department of Transport and Planning. 2025-06-25. Archived from the original on 2025-05-15.
- ↑ WA Main Roads. “Traffic Map”. Archived from the original on 2025-07-12.
- ↑ WA Main Roads. “Historic Traffic Data at Signalised derived by SCATS (Creative Commons Attribution 4.0 International License)”. Archived from the original on 2025-09-25.
- ↑ Jake Coppinger. “Minimum cycle times of Sydney CBD signals in Nov 2017”.
- ↑ Minister for Regional Transport and Roads (2024-02-16). “Travel time data to shine light on journeys around Rozelle Interchange” (Press release). NSW Government. Transport for NSW. Archived from the original on 2025-06-22.
- ↑ 47.0 47.1 Transport for NSW. “DOC A – Traffic Volume – CBD – Cycle Time Change” (PDF). p. 270.
- ↑ 48.0 48.1 48.2 Natacha Doust (2025-03-28). “Notice of decision on your access application under the Government Information (Public Access) Act 2009 (GIPA Act) (10 pages)” (PDF). Letter to Jake Coppinger. Transport for NSW.
- ↑ 49.0 49.1 Yvonne C Lam (2018-11-19). “Sick of Waiting at the Lights? Sydney Lord Mayor Wants to Speed Things Up for Pedestrians”. Broadsheet. Archived from the original on 2025-09-25.
- ↑ 50.0 50.1 Transport for NSW (2018). “Road Safety Progress Report 2018” (PDF). p. 15. Archived (PDF) from the original on 2023-10-21.
- ↑ 51.0 51.1 51.2 Jake Coppinger, Tegan Mitchell, Sara Stace (2025-08-04). “Subject: Request for Public Access of SCATS Signal Phasing Data across one weekday for all NSW signals” (PDF). Letter to Josh Murray, cc. Howard Collins.
- ↑ Jake Coppinger. “Better Intersections”. WalkSydney.
- ↑ Jake Coppinger (2022-12-19). “Sydney CBD is bringing back pedestrian “beg buttons”“.
- ↑ 54.0 54.1 Jake Coppinger (2023-06-12). “Mapping pedestrian traffic light timing in Sydney, Australia”.
- ↑ 55.0 55.1 Jake Coppinger (2024-08-22). “Why Did the Chicken Catch the Metro? Because It Was Faster Than Crossing the Road…”.
- ↑ Transport for NSW (2022-08-01). “Network Operations – Schedule of Fees” (PDF).
- ↑ Jake Coppinger, Tegan Mitchell, Sara Stace (2025-04-16). “Re: Public Access to SCATS Traffic Signal Phasing Data” (PDF). Letter to Josh Murray, Secretary, Transport for NSW. WalkSydney.
- ↑ Brenda Hoang (2025-05-09). “Re: SCATS traffic signal phasing data release 9 May 2025” (PDF). Letter to. Transport for NSW.
- ↑ Brenda Hoang (2025-06-03). “Re: SCATS traffic signal phasing data release” (PDF). Letter to Jake Coppinger. Transport for NSW.
- ↑ 60.0 60.1 Jake Coppinger, Tegan Mitchell, Sara Stace (2025-05-14). “Re: Public Access to SCATS Traffic Signal Phasing Data” (PDF). Letter to Brenda Hoang, cc. Josh Murray, Roy Brown.
- ↑ Yvonne (2025-09-20). “Why won’t Transport for NSW share SCATS Traffic Signal Phasing Data?”. WalkSydney.
- ↑ Daniel Lo Surdo (2025-11-17). “Why this set of Sydney traffic lights could change how we cross the road”. Sydney Morning Herald. Archived from the original on 2025-11-16. Retrieved 2025-11-17.
- ↑ 63.0 63.1 63.2 63.3 63.4 Roy Brown (SCATS Director Technology and Product, Transport for NSW) (2025-10-15). “2025-10-15: SCATS traffic signal extracts from panel discussion at Highways AU”. Jake Coppinger.
- ↑ “SCATS and WalkSydney discussion (private minutes)”. 2025-07-04.
{{cite web}}: Missing or empty|url=(help) - ↑ 65.0 65.1 Professor Peter Wilenski (1978-01-26). “Interim Report of the Commissioner Appointed to Inquire into Improvements in the Machinery of Government and State Government Administration (Review of New South Wales Government Administration – Directions for change: an interim report)” (PDF). Peter Wilenski (1978). Directions for change : an interim report / by Peter Wilenski. ISBN 0724016694.
- ↑ Committee for Sydney (2025-10-15). “Raising Sydney’s Care Factor – The critical role of care work to Sydney’s productivity & prosperity” (PDF). p. 71. Archived (PDF) from the original on 2025-11-18.
- ↑ Transport for NSW (September 2023). “Evaluation of the NSW Pedestrian Protection Program” (PDF). Archived (PDF) from the original on 2023-12-16.
- ↑ Transport for London (July 2018). “Walking action plan: Making London the world’s most walkable city” (PDF). Transport for London. Archived (PDF) from the original on 2025-02-16.
- ↑ “Western Distributor Road Network Improvements”. Transport for NSW. 2025-05-08. Archived from the original on 2025-08-07.
- ↑ “(Untitled Facebook Post)”. BikeSydney. 2025-05-28. Archived from the original on 2025-09-03.
- ↑ Rogan Parker (2022-08-25). “SCATS Management of loop faults and pedestrian reintroduction” (PDF). Auckland Transport Operations Centre (ATOC). Archived (PDF) from the original on 2025-09-24.
- ↑ Anthony Segaert (2025-01-31). “The change to our traffic lights that could make you happier”. The Sydney Morning Herald. Archived from the original on 2025-05-15.
- ↑ Declan Bowring (2023-09-25). “Better Intersections website gathers data on long pedestrian wait times in Sydney”. ABC News. Archived from the original on 2025-09-25.
- ↑ “It’s faster to catch the Sydney Metro one stop than cross this road”. Reddit. 2024-08-24. Archived from the original on 2025-09-25.
- ↑ Jake Coppinger (2024-08-22). “It’s faster to catch the Sydney Metro one stop than cross this road”. YouTube.
- ↑ “Better Intersections website gathers data on long pedestrian wait times in Sydney”. Reddit. 2023-08-25. Archived from the original on 2025-09-25.
- ↑ “Shining a Light on the Traffic Signals of Sydney”. Reddit. 2023-07-11. Archived from the original on 2025-09-25.
- ↑ “Category:Traffic Signals”. WalkSydney.
- ↑ “Pedestrians are fed up with begging”. Bicycle NSW. 2023-08-08. Archived from the original on 2025-07-13.
- ↑ “Constitution Road Infrastructure Upgrade – Community Engagement Outcomes Report” (PDF). City of Ryde Council. May 2025. p. 4. Archived (PDF) from the original on 2025-08-29.
- ↑ 81.0 81.1 Naaman Zhou (2018-09-09). “Placebo buttons: Australian pedestrians press for no reason at traffic lights”. The Guardian. Archived from the original on 2025-09-24.
- ↑ City of Sydney (June 2024). “‘A City for Walking’ Strategy and Action Plan – Continuing the Vision” (PDF). pp. 21, 36. Archived (PDF) from the original on 2025-10-02.
- ↑ “Waverley Bike Strategy” (PDF). Waverley Council. 2025. p. 48. Archived (PDF) from the original on 2025-10-01.
- ↑ Arup (2013-06-21). “Macquarie Park Pedestrian Access and Mobility Plan” (PDF). City of Ryde Council. pp. 11, 109, 126, 129, 155, 157, 159, 211. Archived (PDF) from the original on 2025-10-02.
- ↑ Arup (2014-06-25). “Gladesville Town Centre Pedestrian Access & Mobility Plan (PAMP)” (PDF). City of Ryde & Hunters Hill Council. pp. 63, 117, 118. Archived (PDF) from the original on 2025-10-02.
- ↑ Cardno (2017-04-06). “Parramatta CBD Pedestrian Strategy” (PDF). City of Parramatta. p. 82. Archived (PDF) from the original on 2025-09-01.
- ↑ 87.0 87.1 87.2 Gehl Architects (2020). “Public Space & Public Life Study 2020” (PDF). p. 142. Archived (PDF) from the original on 2025-04-18.
- ↑ Committee for Sydney (February 2020). “Reclaiming Sydney’s High Streets” (PDF). p. 12. Archived (PDF) from the original on 2025-07-14.
- ↑ Aleisha Orr (2024-07-11). “‘Over the top’ or a life-saving move? The push for 30km/h speed limits”. SBS News. Archived from the original on 2024-09-10.
- ↑ “High time – the future of Oxford Street” (PDF). Business Sydney, Robertsday. November 2020. p. 12. Archived (PDF) from the original on 2024-07-05.
- ↑ SGS Economics and Planning (June 2014). “CBD Pedestrian Analysis: Technical Report, City of Melbourne” (PDF). p. 22. Archived (PDF) from the original on 2025-09-24.
- ↑ Department of Transport and Main Roads, Queensland Government (August 2021). “Guideline: Options for reducing pedestrian delays at traffic signals (CC BY 4.0)” (PDF). p. 32. Archived (PDF) from the original on 2025-09-24.
- ↑ “Sydney Metro City & Southwest Chatswood to Sydenham Conditions of Approval” (PDF). NSW Government. p. 32. Archived (PDF) from the original on 2025-09-24.
- ↑ “Block 1 Report – Sydney Metro C&SW – Traffic and Interchange Monitoring” (PDF). AECOM. August 11, 2023. p. 28. Archived (PDF) from the original on 2025-09-24.
- ↑ “Sydney Metro West – Rail infrastructure, stations, precincts and operations Conditions of Approval”. NSW Government. p. 61. Archived from the original on 2025-09-25.
- ↑ “Everything You’ve Ever Wanted to Know About ATSPMs: Harnessing the Power of Automated Signal Performance Metrics for Your Agency – November 9, 2022 (Question and Answer Summary)” (PDF). The Eastern Transportation Coalition. 2022-11-09. Archived (PDF) from the original on 2025-09-24.
- ↑ “Everything You’ve Ever Wanted To Know About ATSPMs: Harnessing The Power Of Automated Signal Performance Metrics For Your Agency” (PDF). The Eastern Transportation Coalition. 2022-11-09. Archived (PDF) from the original on 2025-09-24.
- ↑ 98.0 98.1 Gehl Architects (2007). “Public Spaces and Public Life Study 2007 (Part 2, page 71, PDF page 8)” (PDF). p. 8. Archived (PDF) from the original on 2025-09-24.
- ↑ 99.0 99.1 “SYDNEY CITY CENTRE ACCESS STRATEGY” (PDF). December 2013. ISBN 978-1-922030-62-7. Archived (PDF) from the original on 2018-09-13.
- ↑ 100.0 100.1 Alex Greenwich (2014-03-27). “Sydney City Centre Access Strategy (Notice of Motion, 27 March 2014, Legislative Assembly, NSW Parliament)”. Archived from the original on 2025-08-04.
- ↑ Nigel Gladstone (2018-08-20). “When pushing the pedestrian button works and when it doesn’t”. The Sydney Morning Herald. Archived from the original on 2022-12-06.
- ↑ 102.0 102.1 102.2 Transport for NSW. “Reducing pedestrian waiting times in the CBD (“Briefing: Minister for Transport and Infrastructure, Minister for Roads, Maritime and Freight, For Information), RMS” (PDF). p. 3.
- ↑ 103.0 103.1 Transport for NSW (November 2014). “Sydney City Centre Capacity Improvement Plan Review of Environmental Factors Volume 1” (PDF). Transport for NSW. ISBN 978-1-925217-60-5. Archived from the original (PDF) on 2019-04-02.
- ↑ 104.0 104.1 104.2 Mark Russell; Henrik Malker (11 November 2014). “Sydney City Centre Capacity Improvement Plan Review of Environmental Factors Volume 2 – Appendices” (PDF). Transport for NSW. ISBN 978-1-925217-60-5. Archived from the original (PDF) on 2015-03-20.
- ↑ Cairns, Sally; Atkins, Stephen & Goodwin, Phil (2002). “Disappearing traffic? The story so far” (PDF). Proceedings of the Institution of Civil Engineers – Municipal Engineer. 151 (1). doi:10.1680/muen.2002.151.1.13. Archived (PDF) from the original on 2025-06-19.
- ↑ NRMA (June 2019). “Look up: Keeping pedestrians safe (Road Safety Series)” (PDF). p. 8. Archived (PDF) from the original on 2025-09-24.
- ↑ New York City Department of Transportation (2019-08-30). “Distraction Shouldn’t Be Deadly” (PDF). Archived (PDF) from the original on 2025-08-29.
- ↑ Natacha Doust (2025-03-13). “Extending the timeframe for deciding your application under the Government Information (Public Access) Act 2009 (GIPA Act)” (PDF). Letter to Jake Coppinger. Transport for NSW.
- ↑ Nick Yetzotis (2025-02-18). “Request for an advance deposit of processing charges under the Government Information (Public Access) Act 2009 (GIPA Act)” (PDF). Letter to Jake Coppinger. Transport for NSW.
- ↑ Manisha Prakash (2025-05-12). “Your Internal Review under the Government Information (Public Access) Act 2009 (GIPA Act) (IR Ack)” (PDF). Letter to Jake Coppinger. Transport for NSW.
- ↑ Jarrod Whitbourn (2025-06-02). “Notice of decision on your access application under the Government Information (Public Access) Act 2009 (GIPA Act)” (PDF). Letter to Jake Coppinger. Transport for NSW.
- ↑ “25T-1151 – Info for Release – ITEM 1 – Briefing Notes (12 pages)” (PDF). Transport for NSW.
- ↑ Roads and Maritime Services (December 2017). ““Improving pedestrian accessibility in the CBD”, (Briefing: For Approval, to John Hardwick, RMS)” (PDF). p. 1.
- ↑ Transport for NSW. “Doc C – Bus Travel Time – Single Trip / Multi Days” (PDF). p. 274.
- ↑ Transport for NSW. “Bus Travel Time – By Scheduled Hour Band” (PDF). p. 276.
- ↑ Transport for NSW (February 2017). “2017 Bus Opal Assignment Model data”.
- ↑ Transport for NSW (February 2018). “2018 Bus Opal Assignment Model data”.
- ↑ Transport for NSW (2018). “25T-1151 – ITEM 4 – Info for Release – Emails (45 pages)” (PDF).
- ↑ Transport for NSW (2018). “Reducing Pedestrian waiting times in the CBD evaluation – Daily Summary (02/01/2018 – 15/03/2018 [inferred])” (PDF).
Leave a Reply