Update 2025-06: TfNSW summarised and responded to community feedback in the REF Determination Report (2025-05). A “review” of the traffic modelling was carried out, resulting in a revised Transport Impact Assessment. This review …“identified some modelling discrepancies requiring adjustments to model inputs and parameters, as well as opportunities to further optimise future signal coordination”. TfNSW has not published what input and parameter “adjustments” were made that result in the new modelling predicting an 82.7% higher network speed (AM peak) and 57% drop in average network delay (PM peak) compared to the previous modelling.
Update 2025-08-28: Jump to the Postscript section for newly released modelling documents.
This is a lightly edited submission for the Epping Bridge Project concept design and Review of Environmental Factors that I wrote in collaboration with volunteers on behalf of Better Streets.
Corrections, comments, and constructive criticism is much appreciated – either as a comment below, via Mastodon or privately to [email protected]. Thanks very much to all the volunteers, wider advocacy groups and Better Streets leadership who reviewed this submission.
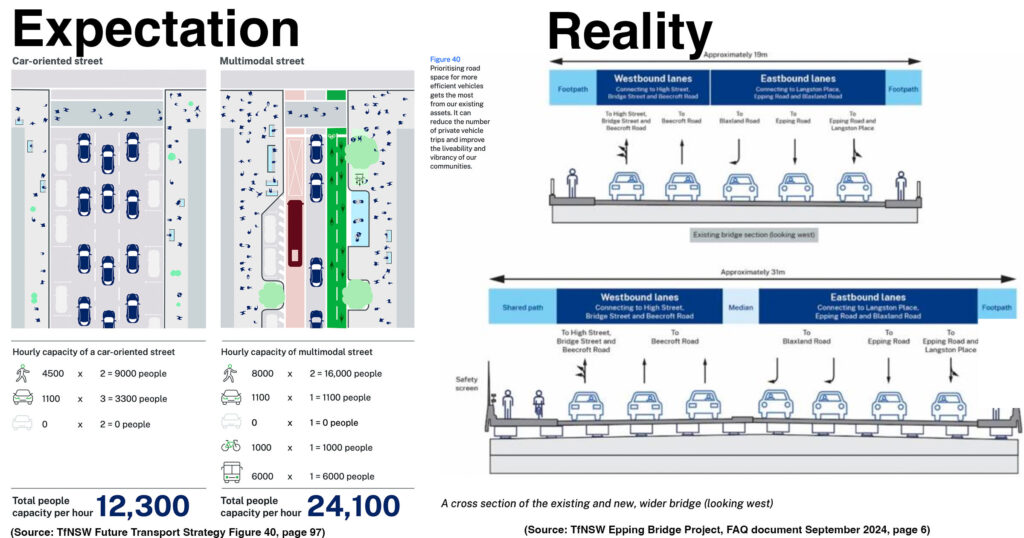
Better Streets does not support the concept design of the Epping Bridge Project. It is first and foremost a road widening project (5 car lanes to 7 car lanes). It does not follow Transport for NSW’s own Road User and Space Allocation Policy or Movement & Place design framework, and at $220 million costs double the allocation for active transport for the entire state over the next 4 years! It is alarming that TfNSW is not following their own excellent policies – the local community would be the beneficiaries.
The Transport Impact Assessment explains “The Australian and NSW governments are jointly funding the replacement of Epping bridge (the bridge) to ease congestion, improve connectivity, and improve safety for road users in North-West Sydney”.
The FAQ document states: “Extra capacity is being provided through the provision of an additional westbound traffic lane into Beecroft Road and an additional right turn lane southbound into Blaxland Road. The additional two lanes of traffic will ease congestion in both directions across the bridge, resulting in travel time savings for road users.”
The only problem – it won’t work! The project’s own modelling shows adding lanes will not ease congestion and travel time savings will not persist beyond 2029. Anyone paying attention to transport policy this century knows widening a road will not reduce congestion long term (“How to Fix Traffic Congestion In Australia”, Utopia, 2023. Page 897, The Power Broker: Robert Moses and the Fall of New York Caro, Robert, 1974)
Modelling predicts that after five disruptive years of construction, the average network speed would increase by a single km/h in the AM and PM peaks in 2029 – followed by a 8 km/h (31.8 percent) drop in the PM peak network speed within a decade.
Average vehicle delay is modelled to drop from 148.8 seconds to 134.4 seconds (a 14.4s drop) in the morning peak and from 141.3 to 131.4 seconds (just a 9.9s drop) in the afternoon peak after construction.
It’s completely nonsensical – and temporary. Modelling suggests the PM peak average network delay will increase to 235.1 seconds by 2039 (an increase of 131.4s after a decade). This is 13.2 times or 1320% the network delay saving anticipated by 2029. That is, in 2039, the celebrated 2029 PM peak delay saving will be eroded twelve times over.

But what would happen in 2039 if the project wasn’t built? We don’t know – because modelling was not done (or is redacted and secret). We can only assume it is not supportive of the project. How much would the bridge cost if it is rebuilt but not widened? We don’t know – costing was not published.
The Transport Impact Assessment itself admits that the project will not prevent congestion increases past 2029, but that mode shift to public and active transport would help mitigate the congestion increases (PDF page 36).
This report details criticism of the report, analysis and errors in the modelling results, and recommendations to increase mode shift to public and active transport – based on best practice policy and still delivering the political promises to widen the bridge and reduce congestion. Feel free to jump to the Recommendations section.
Better Streets is Australia’s peak body for safer, healthier and more sustainable streets. The Better Streets coalition includes a large number of volunteers and organisations – our aims are listed at betterstreets.org.au and coalition members are listed at https://www.betterstreets.org.au/coalition
This report was written (in their leisure time) by Jake Coppinger in collaboration with Better Streets volunteers and reviewed with Better Streets leadership. All authors are volunteers and do not have a traffic engineering background. Corrections, comments, and constructive criticism is much appreciated – please forward to [email protected]. Thanks very much to all the volunteers and wider advocacy groups who helped review this document.
Table of contents
- The design will not achieve the project goals
- The road will not ease congestion or meaningfully reduce travel times
- There is little evidence the project will improve road safety
- The project does not deliver value for the taxpayer's money
- "Improving access" to Epping town centre is a project objective but it reduces access for pedestrians
- Videos and measurements of experienced pedestrian delay and accessibility
- There are no promises given on reducing signal cycle time or wait time for pedestrians
- Split signalised crossing east of Epping road would likely increase pedestrian wait times
- The staged pedestrian crossing is required due to changes to prioritise motor vehicles above pedestrians and cyclists
- Improving connectivity for cyclists is a project objective but it does very little
- The project goals are flawed
- "Increasing road capacity" by adding more general car lanes should not be a goal and it not in line with TfNSW policy
- 89% of trips crossing the bridge are through trips that do not start or end at Epping Town Centre
- The project does not consider connection to the parkland or unbuilt high density housing
- The project does not follow TfNSW policy
- Recommendations
- 1. Review and publish how the project performs against the TfNSW Road User Space Allocation Policy
- 2. Increase bridge capacity using mode shift and dedicated bus lanes, not adding more lanes for cars
- 3. Narrow the width of the general traffic lanes
- 4. Remove the Langston Place slip lane
- 5. Close High St to through traffic and open it to pedestrians and cyclists
- Appendix
- Postscript: Documents on updated modelling
- Further reading
The design will not achieve the project goals
The road will not ease congestion or meaningfully reduce travel times
Relevant policies and studies on induced demand
In the spirit of the outdated predict & provide approach, the project seeks to reduce congestion and increase motorist traffic flow by adding more road lanes. Easing congestion or reducing travel times for motorists should not be primary goals of a transport project this century, but this section demonstrates it fails to achieve even that.
The 2011 Epping Town Centre Study itself acknowledged demand management is more critical than increasing capacity: “In congested urban areas in particular it is widely recognised that strategies to manage demand will be more critical to transport operations than strategies to increase the capacity of existing roads.”
Similarly the Engineers Australia Urban Transport systems 2023 Policy and planning advice report describes the policy failure of road widening projects:
Too much emphasis and funding has been directed to road widening projects to the detriment and serviceability of other modes of transport. While car drivers have a good choice of travel on a connected road network, potential walkers and cyclists are significantly constrained, due to a lack of safe routes and road crossings. Public transport users are impacted by inadequate network connectivity and proximity to services in outer areas and a lack of priority routes in congested inner areas
Our research has found that the phenomenon known as induced demand influences how people travel. It also influences the effectiveness of infrastructure designed to increase capacity and reduce congestion. When a road or freeway is widened, or a new road is built, in an area where roads are congested or near capacity, induced traffic on the widened road increases traffic on the surrounding roads that have not been widened, resulting in system wide increased congestion.
Induced demand is not limited to cars – this report also describes the effect on building cycleway infrastructure:
Induced demand also occurs when improvements are made to public transport and cycling (Richardson and Burgess, 2005)
Curiously, the Transport Impact Assessment does not provide any 2039 modelling if the project does not go ahead, so it’s impossible to quantitatively measure benefits of the project past 2029. This is a concerning lack of transparency regarding the modelling information on one of the most crucial pages of the most crucial report, and suggests the numbers are not favourable to the project going ahead. Better Street’s volunteer Jake Coppinger made a request for this data on Tuesday Oct 1st and has not yet received it. We look forward to seeing this data published.
The project will only increase network speed by 1 km/h to 2029 and a 32% drop after a decade in the PM peak


The “Operational Performance With & Without the Proposal” table (Figure 4-1, PDF page 36) of the Transport Impact Assessment states that the average network speed would increase by a single km/h in the AM and PM peaks by 2029 (22 to 23 km/h) as a result of the $200 million upgrade project.
Below the table is the statement “Average vehicle speeds are increased by 6.5% and 4.5% in the 2029 AM and PM peaks, respectively”.
One of these statistics appears to be incorrect – the table describes the project increasing the AM peak average vehicle speed from 22 km/h to 23 km/h, an increase of 4.5%. 6.5% would necessitate the average speed increase to 23.43 km/h. Other rows use decimal places (such as fractional durations of seconds) but the speed figures are whole numbers.
Increasing the speed of cars by 1km/h (or maybe a secret extra 0.43km/h) doesn’t have any meaningful impact.
It predicts the average PM peak network speed with the project will drop from 23 km/h in 2029 to 15 km/h in 2039, a drop of 31.8 percent.
If the report is claiming that increasing average network speeds by 1 km/h in 2029 will ease congestion and improve travel times, then it should highlight that within the decade this will drop 31.8%.
Easing congestion or reducing travel times for private vehicle motorists should not be primary goals of a transport project this century, but spending $220 million, increasing vehicle speeds by 1 km/h, saving only up to 14 seconds and still suffering a 31.8% reduction in average network speeds within a decade is a terrible outcome for even the most predict & provide thinking, car focused traffic engineer.
Average vehicle network delay will only drop by 10 seconds in the PM peak


The proposal claims below Fig 4-1 that “Average vehicle delay is reduced by 9.7% and 7.0% in the 2029 AM and PM Peaks, respectively”.
In the 2029 AM peak, the project is forecasted to reduce vehicle delay from 148.8 seconds to 134.4 seconds, a reduction of 14.4 seconds.
In the 2029 PM peak, vehicle delay is forecast to reduce from 141.3 to 131.4 seconds, a reduction of 9.9 seconds.
To put these numbers in perspective, a car driving at the predicted increased travel speed (23 km/h) for 9.9 seconds would cover an additional 23 / 60 / 60 * 9.9 * 1000 = 63 metres. Under the current proposal, in 2029 you could expect your car to be 63 metres further ahead in the afternoon traffic jam (moving 1km/h faster) on average.
By 2039, the modelling suggests that the PM average network delay will increase to 235.1 seconds, an increase of 131.4 seconds from the 2029 with project modelling estimate. 131.4 seconds is 131.4 / 9.9 = 13.2 times or 1320% the network delay saving anticipated by 2029. That is, in 2039, the celebrated PM peak delay saving in 2029 will be eroded twelve times over.
How does the 2039 with project case compare to the do nothing scenario? We don’t know – because modelling was not done, or is redacted and secret (refer to Fig 4-1 of the Transport Impact Assessment).
In a particularly insightful paragraph, the Transport Impact Assessment (pg 36) concedes the project will not mitigate increased congestion past 2029, but that modal shift to public and active transport could:
It must be noted that 2039 modelling with proposal has decreased average network speed compared to 2029 without proposal in the PM peak and network delay will increase past the 2029 without proposal.
However, this is subject to anticipated growth used in modelling. There is potential that future modal shift, public and active transport, would limit the delay increase.
Another way to put these network delay numbers in perspective is to compare them to the delays faced by pedestrians. Crossing the 3 traffic signals where there is a missing traffic signal crossing takes 270 seconds. The east and south traffic signals currently operate on a 130 second cycle time, so with the standard 6 seconds green time that’s a 124 second wait. The modelling assumes a 140 second cycle. Even just moving the bus stops 48.5 metres north adds an additional 40 seconds walking time for those switching to or from a bus at the station. This may seem minor, however it is 40/9.9 = 4x or 400% larger than the celebrated reduction in PM peak average vehicle delay.
Furthermore, referencing tables 4-2 of the Transport Impact Assessment document (PDF page 36) & table 6-11 of the Epping Bridge Project Review of Environmental Factors document (pg 75) access to the Epping town centre for all traffic is drastically reduced in some cases or not improved at all in others as the following intersections degrade
- Carlingford Road, Ray Road and Rawson Street all retain a Level of Service (LoS) of F in both tables
- Beecroft Road and Carlingford Road retain their respective LoS in both tables
- Bridge Street and Rawson Street according to table 4-2 the AM performance goes E to F in 2039 with the proposal. While Table 6-11 has the intersection AM performance remaining at a C LoS it shows the PM peak hour LoS to degrade from C to E in 2039 with the proposal
- Epping Road, Blaxland Road and Langston Place according to both tables in 2039 with the proposal having been implemented LoS is E
- Epping Rd & Essex St according to table 4-2 do not improve. However, looking at table 6-11 the LoS changes from D to C and remains so in 2039
- Beecroft Road, High Street and Bridge Street according to table 4-2 marginally improve from B to A in the AM peak but there is no improvement in 2039 with the proposal implemented. Table 6-11 conflicts with table 4-2 as it suggests that this intersection will remain with a LoS of A in the AM peak & also that in 2039 with the proposal implemented that there will be an improvement from D to C LoS
There is little evidence the project will improve road safety
The project page states the project is “Providing a new, wider, safer and more efficient bridge”.
While it is understood the bridge requires significant maintenance or replacement due to its age and structural condition, unless it is at imminent risk of collapse it is not increasing road safety (the Review of Environmental Factors (REF) states (PDF pg 24) that “Inspections carried out by Transport in October and November 2022 indicated that it requires significant maintenance or renewal.” and “Sydney Trains Bridge Examination Report from 2022 concluded that the bridge is in a deteriorated condition”, however we have not found the report itself). This section will focus on how the project will reduce the risk of injury or death to motorists and vulnerable road users.
Crash data presented (REF PDF pg. 60) showing 4 serious injury crashes, 10 moderate injury crashes and 15 minor or other injury crashes within 5 years to 2022.
The only analysis in the REF is:
Spatial grouping of crashes suggests that there are safety concerns associated with eastbound movement on Epping Road, all movement along Beecroft Road, and westbound movements on Carlingford Road.
In the Transport Impact Assessment, a 64 page document, the entirety of the text in the Safety section (“3.10 Safety”, PDF pg. 31) is:
Crash data statistics for the project area was sourced from the NSW Centre for Road safety website (https://www.transport.nsw.gov.au/roadsafety). These reports provide information on casualties and crashes in NSW over a 5-year period 2018 to 2022.
> A summary of the injury crashes is presented in Table 3-10 and a plot of the crash locations is provided in Figure 3-11.
The central raised median may increase average vehicle speeds due to additional separation negating any safety benefits. It would not be required if the speed limit is lowered (see below section). Raised zebra crossings (that do not follow the pedestrian desire line) and a highway median are insufficient scope for a $220 million project to claim improving road safety is a project goal, especially when an explicit goal is to increase the volume of and reduce congestion for motor vehicles.
The speed limit in the area should be permanently reduced from 60 km/h to 40 km/h (at least)
TfNSW didn’t even consider reducing the speed limit of the street as part of this project. Thankfully, we can see what the impact would be on travel times as it will be lowered during construction.
Lowering the speed limit would not just increase the safety of the local road network, but make the surrounding environment more pleasant for pedestrians, cyclists and local businesses.
Under “Construction speed limits” (REF pg. 68) it is stated that reducing speed limits from 60 to 40 km/h on a total of 1340 metres (1.3 km) of road including the bridge and surrounding roads “would impact free-flow traffic speeds” by “increasing travel time by approximately 26 to 29 seconds per vehicle”.
In “Table 6-5 Proposed road and traffic diversions per traffic stage and their anticipated impact” of the REF (pdf page 64) the impact “Reduced speed and lane closures off peak to remove central medians and splitter islands.” would result in an “Average Network Delay increase from 2023 baseline” of 8.8 seconds.
How 8.8 seconds differs so much from 26 to 29 seconds (even when the 8.8 second figure includes the impact of lane closures) is not clear, and suggests that as traffic rarely flows at free flow speeds, reducing the limit to 40km / h would result in a single digit second delay to motorists.
The average PM peak network speed in 2039 with the project is predicted to be 15 km/h anyway. Additionally, the bridge currently has an advisory speed limit of 25 km/h navigating the turn along Beecroft Rd west/northbound. There is also an advisory speed limit of 25 km/h over the bridge in both directions (Google Street View photo) (the supports for the advisory sign at the south-western corner of Blaxland Rd and Epping Rd (westbound) narrow the footpath further for pedestrians)
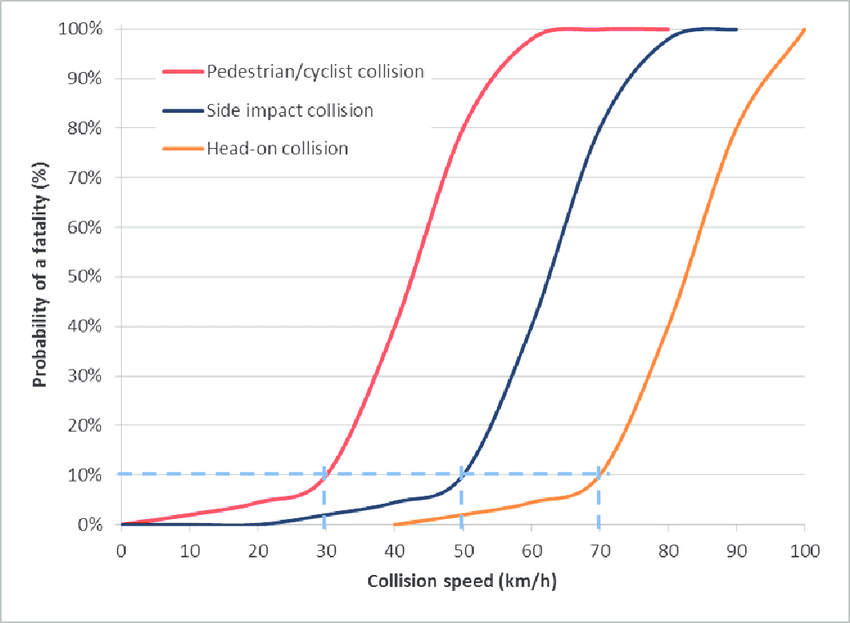
TfNSW’s own “Speeding” page states that in a crash between a car and pedestrian at 50 km/h, there is a 90% probability the pedestrian will be killed. At 40 km/h this drops to a 60% probability, and to 10% for 30 km/h. The risk of killing a pedestrian in a 60 km/h crash is so high that it isn’t even included on this page.
The speed limit on Langston Place should also be changed to 40km/h. While a high pedestrian activity study doesn’t seem to have been conducted there is an advisory sign that the area is a high pedestrian activity area (Google Street View photo). Parts of Rawson street, Bridge street, and Oxford street should also be subject to any future high pedestrian activity studies.
The reference for TfNSW’s risk data is Wramborg, P 2005, ‘A new approach to a safe and sustainable road structure and street design for urban areas’, Road safety on four continents conference, 2005, Warsaw, Poland, Swedish National Road and Transport Research Institute (VTI), Linkoeping, Sweden.
The shared path will not improve safety for pedestrians, and marginally improve safety for cyclists
Adding a short section of shared path adjacent to a 7 lane road is not a satisfactory active transport outcome for a $220 million project adjacent to a major Metro and Sydney trains interchange. This is not sufficient safe cycling infrastructure.
By definition, adding cyclists to a path shared with pedestrians inherently increases risks to pedestrians. How much of an increase this risk is depends on the path width, volume of pedestrians and cyclists, and general design. Critically, there is no proposal to have physical protection for cyclists or vulnerable road users that prevents them from falling into a traffic lane like is found elsewhere on Epping road in the form of fencing.
There is no evidence presented the raised central median will have on safety
If head-on collisions are a significant risk, then a low cost solution that retains more precious street width (for more vulnerable road users) is reducing the speed (as described in above section).
Reducing speeds, lane widths or providing wider footpaths would achieve meaningful safety improvement for vulnerable road users. Implementing safety screens is a good upgrade but should not be considered a major safety feature.
The project does not deliver value for the taxpayer’s money
While it is hard to separate the cost of the necessary bridge replacement and the potentially unnecessary expensive changes in addition (moving the chiller unit from north to south end of the South Services building, bridge widening, signal reconfiguration), $220 million is almost double the entire state’s NSW Get Active (active transport) budget for the next 4 years. Bicycle NSW noted only 25% of 346 eligible projects received funding from this year’s $60 Million Get NSW Active allocation.
A southern station entrance would be welcome but no consideration for it is found in the project documents.
No costing is provided among bridge replacement options for a replacement of a similarly sized bridge without additional lanes for cars.
“Improving access” to Epping town centre is a project objective but it reduces access for pedestrians
There are no new pedestrian access links, and there will be an additional signal pedestrians must wait for when crossing Epping Road. Better Intersections data shows traffic signal timing on state roads is not friendly to pedestrians.
The project is missing the blaring obvious – an additional signalised pedestrian crossing on the west side of the bridge. It is a disappointment that motor vehicles have been prioritised so through the Epping town centre that adding a missing crossing is not even considered. Appendix B of the mandatory TfNSW Road User Space Allocation Policy (pg 8) states that an example consideration for “walking” on “main streets” is to “Provide dedicated or shared walking space & crossings (avoiding severance)“.
The 2013 Epping Town Centre Urban Activation Precinct Structure Plan appears to show (page 21) an improved pedestrian link between Bridge St and Epping Rd (across the north side of Epping Bridge) “subject to investigation”. This would suggest a signalised pedestrian crossing on the west side of the bridge.
The “Epping Bridge Project Overview Video” shows (at 1:50) a large volume of pedestrians on the north side of the bridge. How would they cross to High Street to shop at local businesses? They must feel like they’re in a Geoffrey Smart painting.
If TfNSW was serious about improving access to Epping Town Centre and following international best practice the project would include (in order of idealism):
- an explicit goal to reduce traffic speed to 30 km/h (or at least 40 km/h) and volume along the bridge and the Beecroft Rd shopping precinct (the advisory speed limit on the bridge is currently 25 km/h)
- adding the missing signalised crossing leg to the east of Blaxland Rd as per the TfNSW Movement & Place design solution “appropriate” for arterial high streets
- removal of all slip lanes (Beecroft to Langston, High St, Bridge St) which prioritise motor traffic volume and encourage higher cornering speeds
- and narrowing of the Epping Rd to Blaxland Rd turn radii as it’s currently designed like a slip road
- installation of continuous footpath treatments or raised zebra crossings at High St and Bridge St in alignment with the existing footpath, not set back and disrupting the desire path of pedestrians and cyclists
- Installation of a raised zebra crossing to ensure that the shared path on Bridge street continues across the Rawson street roundabout intersection
- Ensuring pedestrian protection in traffic signal phasing so no motorists can turn when pedestrians are still crossing the road
- adding a signalised crossing at the west side of the bridge to enable pedestrians and cyclists to access High St and Bridge St (and all of western Epping) from the Langston Place bicycle shed and Beecroft Rd northbound bus stands
- ensuring all pedestrian signals have a max wait time of 30 to 45 seconds (rather than the current 124 seconds) as per international best practice and the City of Sydney’s excellent Walking Strategy & Action Plan
- Adding a signalised crossing in parallel to the Beecroft Rd pedestrian bridge (with a 30s max pedestrian wait) so that pedestrians can cross from the bus stands to the local shops effortlessly
- This would provide redundancy in the case of lift failures
- using congestion pricing to reduce demand for single occupancy vehicles where there is limited road capacity, as there is roughly parallel commuter rail, driverless metro, the M2 motorway and potential bus routes
That these features or goals appear so lofty and idealistic shows how out of step this project is with international best practice and TfNSW’s own policy on prioritising pedestrians and cyclists.
Videos and measurements of experienced pedestrian delay and accessibility
Pedestrian delay at traffic signals (to one decimal place)
The public shouldn’t have to capture this data – it should be provided in the Transport Impact Assessment.
See all data (or more recent measurements at https://betterintersections.jakecoppinger.com/?lat=-33.7735&lon=151.0827&zoom=17.3532
| Crossing | Green duration (s) | Flashing Red duration (s) | Red duration (s) | Cycle time (s) | Max pedestrian wait (s) |
| Crossing Langston Pl north of Epping Rd | 95.5 | 10.5 | 25.1 | 131.2 | 35.7 |
| Crossing Epping Rd east of Blaxland Rd | 5.6 | 19.6 | 104.6 | 129.8 | 124.2 |
| Crossing Blaxland Rd south of bridge | 6.2 | 19.6 | 105.5 | 131.3 | 125.0 |
Measured durations to cross the street
Any corrections, improved measurements or additional location measurements are greatly appreciated.
| Crossing | Duration (seconds) | Direct distance (m) | Walking distance (m) | Level of Service rating for total delay for pedestrian delay or detour (VicRoads, 2014) | Notes | Video recording |
| Blaxland Rd outside Jerome Laxale MP’s office | 410 | 20 | ~264 | E+ | This is only 20 metres as the crow flies | https://youtu.be/uxOqtsybMDw |
| Crossing Epping Bridge west of Blaxland Rd (the missing signalised leg) | 270 | 20 | 20 | E+ | Best practice is 30 – 45 seconds (City of Sydney’s Walking Strategy & Action Plan) | https://youtu.be/uxOqtsybMDw |
| Cycling from Langston Pl bicycle parking using north bridge footpath (won’t be upgraded to shared path), crossing 5 lanes of traffic (PM peak) to get to Bridge St | 396 | ~80 | ~100 | E- | This is the cyclist desire line from the bike parking to Bridge St. Extremely dangerous road crossing (but not illegal). Would be ~40 seconds if there was no traffic. | |
| Walking from Bridge St to Langston Pl bicycle parking | 371 | ~80 | ~197 | E | Project proposal only converts 38 metres of this to shared path, and adds extra signal to Epping Rd, so could end up even slower. | https://youtu.be/uxOqtsybMDw |
There are no promises given on reducing signal cycle time or wait time for pedestrians
In fact, the proposal is modelling using a 140 second cycle time (Transport Impact Assessment, PDF page 33), a 10 second increase on the current measured cycle time in the PM peak!
Split signalised crossing east of Epping road would likely increase pedestrian wait times
The signalised pedestrian crossing across Epping Rd east of the bridge is currently a single stage crossing – that is, when the pedestrian light turns green you walk across the complete width of Epping Rd. The cycle time was measured as 130 seconds, a maximum pedestrian wait time of 124 seconds, and is an unprotected crossing (cars have a green signal to turn while pedestrians have a flashing red signal and are completing their crossing)
The project includes a staged crossing here as a feature, and features prominently in the video. The REF states (pg. 36):
The staged crossing allows greater flexibility with signal phasing at the busy intersection and safer pedestrian movements.
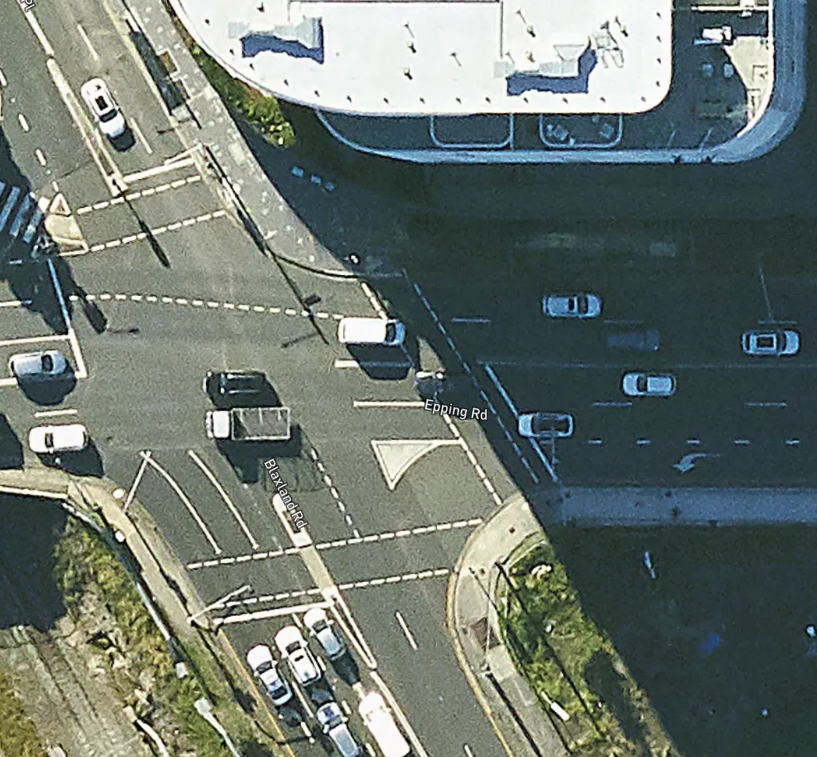
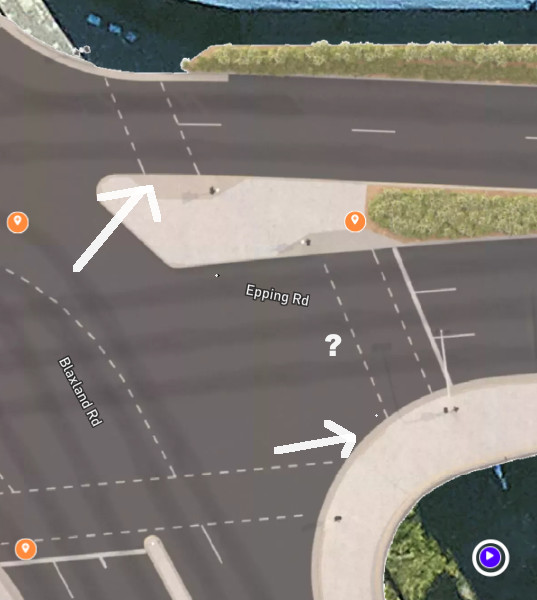
The below photo depicts the current crossing:
However the proposed changes to the bridge show the following:
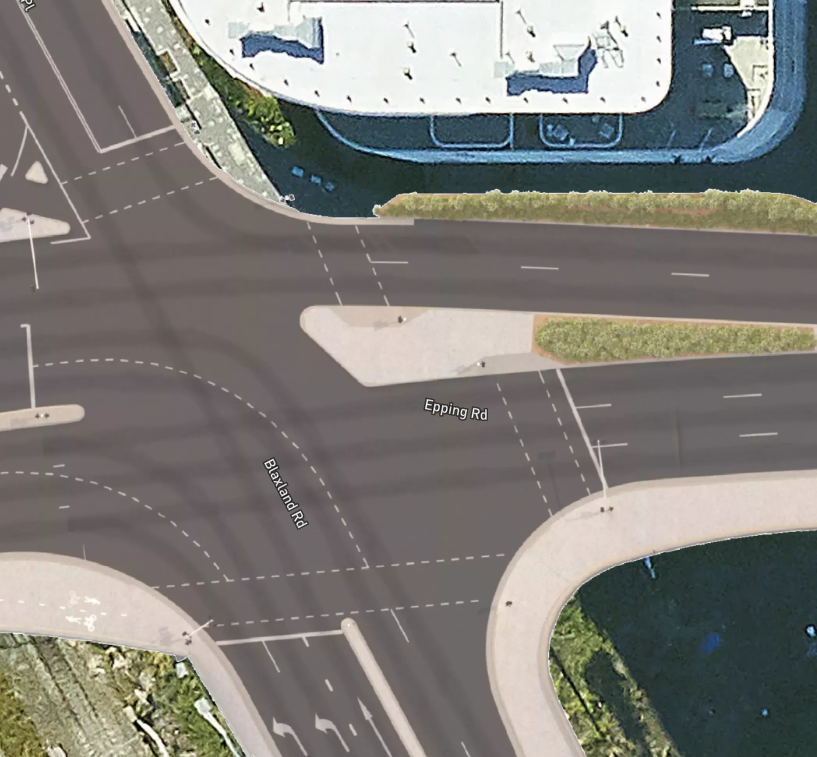
- They move the pedestrian crossing eastwards on the south east side
- The crossing lines are also no longer aligned
An additional staged crossing likely means pedestrians (and cyclists) will have to wait an additional signal phase to cross the second half of the road. This would increase the max wait time from 124 seconds to potentially much longer.
If safer pedestrian movements are desired, the traffic signals can be reprogrammed to not display a green light for cars when pedestrians are still completing their walk. The phrase “greater flexibility with signal phasing” makes it clear this modification is designed for the benefit of increasing traffic flow for cars and not because it is an improvement for pedestrians.
The staged pedestrian crossing is required due to changes to prioritise motor vehicles above pedestrians and cyclists
The Transport Impact Assessment (pg. 40) states under 4.4 “Active Transport”:
The proposal requires changes to the layout of the pedestrian crossing at the intersection of Epping Road and Blaxland Road and Langston place.
The REF states under 3.2.2 “The staged crossing allows greater flexibility with signal phasing at the busy
intersection and safer pedestrian movements” and the Transport Impact Assessment states under 4.4.1 (page 40): “The crossing, as proposed in the Definition Design was more than 32m long”.
Why does it require these changes that widen the road? It is not stated anywhere. The proposal does not include any new lanes added to Epping Rd east of the intersection so there is no “necessary” widening of Epping Rd.
It does not state the current width of the crossing, but given the crossing lantern for pedestrians was measured to flash red for 19.5 seconds, and signal timing assumes a pedestrian speed of 1.2m/s, we can estimate the crossing is 23.2 metres wide – almost 2 full metres narrower than the design threshold stated requiring an island:
When crossings exceed 25m in length, it is a design requirement to provide a median refuge area, with push-button, in case a slow walker fails to complete their crossing in the standard clearance time and becomes stranded
In either case – the media refuge area could be provided in addition to retaining a single phase for pedestrians to walk across the road in one go, and the signals could not allow cars to filter until the end of the flashing red light. TfNSW is implicitly choosing not to provide these pedestrian affordances to prioritise motor vehicle traffic at the expense of pedestrian safety.
During this time, traffic exiting Langston place is held up by the red arrow pedestrian protection requirements. This extension of the C- Phase for Langston Place traffic movements would be at the expense of more important traffic movements.
The red arrow pedestrian protection should be present for the entire duration of the green and flashing red time, not just the start.
Not only is this sentence explicitly stating that preserving the minimum amount of safety for pedestrians would impact “more important traffic movements” (that is, motor vehicles movements are considered more important than pedestrians, contrary to TfNSW policy), but “held up” motor vehicles is no way to talk about pedestrian access and safety.
Pedestrians should not be “held up” by unnecessary long traffic signals directly outside a Metro station, across from a bike shed and lockers, and between two R4 zoned high density residential areas.
With a single crossing, active transport users can only start their crossing in the first part of C-phase. That is a short 6-second ‘Walk’ window in a total cycle time of 130 seconds. The staged crossing provides more windows of opportunity to cross, particularly in the northbound direction.
If Transport for NSW really wanted to give pedestrians more opportunities to cross just 6 seconds out of every 130, they could increase the green time and reduce the traffic signal cycle time. Not doing so is prioritising motor vehicle traffic ahead of pedestrians.
The TfNSW Road User Space Allocation Procedure explicitly states the task (Allocation of modes within the road/street) “Are there opportunities to allocate road user space temporally to reduce physical requirements or facilitate use by high priority modes?”. It states that pedestrians are the highest priority mode.
This intersection will be directly adjacent to 5-8 story apartment buildings
Little note in the project is given to the pedestrian amenity for the buildings to be developed on Epping Rd and Blaxland Rd.
Page 36 of the REF states
> However, the amalgamated residential lots have a deferred commencement for 5-8 storey apartment buildings, which will result in a more built-up urban character
There will potentially be a large increase in the volume of pedestrians crossing at this location.
This does not even include a number of other nearby approved or under construction developments:
- Approved – 48-54 Rawson street, 300m from the bridge – https://www.planningportal.nsw.gov.au/planning-panel/mixed-use-2
- Being built – Cielo (37-41 Oxford St) – 400m – https://www.theurbandeveloper.com/articles/triguboff-meriton-parramatta-court-win-carparking
- 2-4 Cambridge Street, Epping NSW 2121 – Epica Epping – https://www.epicaepping.com.au/
- Likely redevelopment of 59-77 & 72 Beecroft road as DA/135/2024 / PAN-413534 granted approval to demolish the buildings
It also left out the Pre-Exhibition planning proposal for 53-61 Rawson street Epping (https://www.planningportal.nsw.gov.au/ppr/pre-exhibition/53-61-rawson-street-epping).
Improving connectivity for cyclists is a project objective but it does very little
The REF states under “Proposal objectives” (heading 2.2, page 31) that specific objectives include:
- provide for future cycle and pedestrian connectivity through the town centre
- improve access to the town centre for the local community, road users and businesses
- improve cyclist and pedestrian safety through the delivery of a pedestrian and bicycle shared path, and new bridge safety screens
The REF states “The existing pedestrian network within this study area allows for adequate connectivity and accessibility around the precinct.” under 3.4 “Active Transport (PDF pg. 21). This is false. Four paragraphs later it states “Apart from the east-west off-road shared path along Epping Road and Bridge Street, there are limited cycle facilities provided in the station precinct”.
The short section of shared path on the south side of the bridge is welcomed, but it is insufficient considering the size of the project ($220m) and scale of the works.
The Transport Impact Assessment states (under heading 3.4, page 21):
Apart from the east-west off-road shared path along Epping Road and Bridge Street, there are limited cycle facilities provided in the station precinct. It is also noted that the Epping Road shared path does not connect with the secure bike parking facilities, to the north, in Langston Place (34 parking spaces and 20 lockers).
The existing bicycle parking has only 3 horizontal bike racks offering 6 bike places (~17%) and 28 vertical bike racks (82%). As per the TfNSW “Bicycle Parking Facilities” standard (T MU SS 90007 ST, 2018), the preferred split between horizontal and vertical bike parking is 50%.
Criticism related to pedestrian amenity at signals also apply to cyclists (missing crossings, cycle times etc).
Additionally, while there are cyclist lanterns for the south and eastern legs of the Epping Rd / Blaxland Rd intersection, there is no lantern for the northern leg of this intersection. It is shameful that the Transport Impact Assessment does not identity this flaw and pretends the northern leg doesn’t exist (under 3.4 Active Transport, page 21):
The eastern shared path is directed north, across Epping Road, to Langston Place, at the Blaxland Road and Epping Road signalised crossing. Both pedestrian and cycle lanterns have been provided at this crossing point.
The Transport Impact Assessment notes that cyclist volumes on the southern footpath are currently low (two cyclists per hour), but neglects to mention that cycling across this path is illegal. This is a path directly adjacent to an important interchange Metro station, in between Epping Town Centre, future high density development and parkland (Forest Park).
The project goals are flawed
“Increasing road capacity” by adding more general car lanes should not be a goal and it not in line with TfNSW policy
The mandatory TfNSW Road User Space Allocation Policy states explicitly states “When allocating road user space, the following outcomes are to be avoided”, “…where reasonably practicable and feasible” – “an overall increase in general traffic lanes for private motorised vehicles” (heading 3.2, pg 3)
The 2013 Epping Town Centre Urban Activation Precinct Planning Report states on PDF page 52, under “9.3 Capacity of the road network”:
The traffic study acknowledges that although these works will assist traffic flows, strategies to manage demand by reducing car usage will be more critical than strategies to increase capacity of existing roads. Encouraging people to use alternative modes of transport in order to relieve congestion is a priority
Specifically, PDF page 34 of the Transport Impact Assessment boasts an increase in the number of vehicles eastbound of 580 vehicles/hour along Beecroft Road and Carlingford Road and 230 vehicles/hour on Carlingford Rd eastbound
Epping station alone had 6,688,540 passengers in 2023 (Data source). That is roughly 18,324 passengers a day. The train and metro services that pass through Epping, in a similar fashion to vehicles driving over the bridge, carry a lot more passengers. For example, in the first week of the Sydney Metro’s M1 Northwest city connection being opened 1.4 million trips were recorded with the most busy day having 220,000 trips taken (source).
Level of Service for car metrics should not underpin a project adjacent to a major train station
The mandatory TfNSW Road User Space Allocation Policy states “To give effect to the principles, Transport must:”
adhere to these principles ahead of any guidance that seeks to protect or maintain private vehicle level of service.
(under 3.2, Requirements, page 3)
The TfNSW Movement and Place framework explicitly encourages usage of the ‘Vision and Validate’ methodology:
Vision and validate diverges from traditional ‘predict and provide’ approaches which have dominated planning for transport, land-use and infrastructure over the last century. Predict and provide approaches use current trends to predict future needs. This can result in reinforcing unsustainable transport and land-use patterns.
89% of trips crossing the bridge are through trips that do not start or end at Epping Town Centre
One of the stated positive contributions of this proposal is that it would “increase westbound lane capacity through the town centre”. However, it is questionable as to if this is desirable as Rawson Street is the main street of the western side of Epping.
According to the NSW Movement and Place Design Guide main streets need to “Provide safe and comfortable conditions for walking and cycling” and as part of this “design measures should prioritise reducing the speed and volume of vehicles and encourage mode shift to sustainable modes.”
Noting that the 28 May 2018 Parramatta Council meeting agenda including the following from the 2017 EMM Interim Traffic Study (2017) (page 850):
Approximately 89% of trips that cross the bridge are through traffic trips where the origin and destination of the trip is outside the Epping Town Centre.
…
The increasing road traffic congestion occurring in the Town Centre area, is adversely affecting both the regional through traffic movements and local traffic accessibility to the major road network.
And according to the Traffic Impact Assessment for 53-61 Rawson Street Epping (PDF):
The surveys found that during the AM period (6:30am to 9:30am) and PM period (3:00pm to 7:00pm), around 71 and 39 per cent of traffic originates from external to the town centre respectively. Further, during the specific peak hours identified in Section 2.3.1, 67 per cent and 43 per cent of traffic originates from external to the town centre. These results indicate that Rawson Street is currently used as a rat run for vehicles external to the town centre to turn onto Carlingford Road and travel south towards Epping Road/ Blaxland Road, particularly during the AM peak period.
The project does not consider connection to the parkland or unbuilt high density housing
The Epping Town Centre Urban Activation Precinct Structure Plan (PDF page 25) states that the land on the corner of Epping Rd and Blaxland Rd is zoned R4, with a floor space ratio of 4.5 (page 26).
Aside from the problematic Sydney pattern of placing high rise towers directly adjacent to major arterial roads, the amenity of this new housing has not been given any consideration in the proposal (eg. see “Improving access” to epping town centre is a project objective but it reduces access for pedestrians”)
The project does not follow TfNSW policy
The project does not follow the TfNSW Road User Space Allocation Policy
The newly updated Road User Space Allocation Policy (July 2024) provides Transport for NSW with a stronger mandate to find a better balance between movement and place, with priority given to people walking, cycling and using public transport.
The policy states among other requirements that Transport must:
Under “3.2 Requirements”, TfNSW Road User Space Allocation Policy, PDF page 3
- document the strategic intent of all road user space allocations, including all changes
- track how the road space allocation principles are being implemented against the strategic intent and outcomes identified as part of strategies or plans
- document road user space trade-off decisions, providing evidence and reasons
- ensure proper endorsement by the relevant Transport governance body
- demonstrate adherence to this policy as part of internal Transport assurance reviews and INSW reviews for projects proposing changes to road space
- report periodically on all road-related projects to enable monitoring against this policy
- adhere to these principles ahead of any guidance that seeks to protect or
maintain private vehicle level of service.
The policy explicitly states “When allocating road user space, the following outcomes are to be avoided”, “…where reasonably practicable and feasible” – “an overall increase in general traffic lanes for private motorised vehicles” (heading 3.2, pg 3)
It also includes:
- as a road user space allocation principle: “consistent with the road function being performed, we aim for the overall reduction of the mode share of private motor vehicle trips within built-up areas”
As per heading 4 “Compliance and breach”:
Compliance with this policy and related procedure/s is mandatory.
Projects may be subject to audit for compliance with the Policy
The Epping Bridge Project does not appear to be compliant, and it should be audited for compliance.
The project is not compliant under the NSW Net Zero and Climate Change Policy
The Review of Environmental Factors (Page 146) states
> Improvements to active transport through upgrades to the bridge’s shared path may increase the number of pedestrians and cyclists through to the town centre and subsequently reduce the amount of fuel consumed by private motor vehicles, with a corresponding relative reduction in associated greenhouse gas emissions in the local area. Once operational, the Proposal would produce minimal carbon emissions from traffic and street lighting.
This claims that improvements to active transport (by adding a shared path) may improve the mode share which would “subsequently reduce the amount of fuel consumed by private motor vehicles”. This sentence completely fails to grasp that the project has a stated aim of increasing road capacity and provides a tiny amount of new cycling infrastructure. As Bicycle NSW noted, $220 millions is double the allocation for active transport for the entire state over the next 4 years! Only 25% of 346 eligible projects received funding from this year’s $60 Million Get NSW Active allocation.
The NSW Net Zero and Climate Change Policy includes under “3.2 Resourcing and uplifting” (page 3):
• promoting a shift to zero or low emissions transport modes, including public and active transport, and multimodal mobility
• stabilising vehicle kilometres travelled (VKT) in Greater Sydney through effective travel demand management and improving public and active transport provisions
The Transport Impact Assessment states the project will result in an increase in the vehicle kilometres travelled from 9844 in the 2029 AM peak to 10084 in 2039, and 9894 in the 2024 PM peak to 10060.
This project will not reduce the vehicle kilometres travelled in the decade after completion, and is not promoting a shift to public or active transport. Prioritising active transport and reallocation road space to public transport (ie. dedicated bus lanes) would. It does not appear compliant with the NSW Net Zero and Climate Change Policy.
The project does not meet the “Signalised crossings on all intersection legs” Movement & Place design solution
The TfNSW Movement and Place design solution “Signalised crossings on all intersection legs” states “Allow people walking and cycling to more easily continue to their desired destination by incorporating crossing on all legs of an intersection.”
Beecroft Road is a destination high street or arterial high street (a stroad, if you will) – and this design solution is designated an appropriate treatment for these street types.
Recommendations
1. Review and publish how the project performs against the TfNSW Road User Space Allocation Policy
The project does not mention the mandatory TfNSW Road User Space Allocation Policy once.
It states:
To give effect to the principles, Transport must:
Under “3.2 Requirements”, TfNSW Road User Space Allocation Policy, PDF page 3
- document the strategic intent of all road user space allocations, including all changes
- track how the road space allocation principles are being implemented against the strategic intent and outcomes identified as part of strategies or plans
- document road user space trade-off decisions, providing evidence and reasons
- ensure proper endorsement by the relevant Transport governance body
- demonstrate adherence to this policy as part of internal Transport assurance reviews and INSW reviews for projects proposing changes to road space
- report periodically on all road-related projects to enable monitoring against this policy
- adhere to these principles ahead of any guidance that seeks to protect or
maintain private vehicle level of service.
Transport should review this project to enable monitoring against the policy and publicly document road user space trade-off decisions (providing evidence and reasons).
2. Increase bridge capacity using mode shift and dedicated bus lanes, not adding more lanes for cars
If the bridge is to be widened, the additional width should be utilised for bus only lanes or widened footpaths / cycleways to meet TfNSW’s mode shift and climate objectives.
Adding bus lanes on both sides of the bridge would mean that TfNSW (and Labor) still meet the election promise (building a new bridge + fixing congestion + increasing capacity) but would not induce new motor vehicle traffic right on the doorstep of the Epping Town Centre (of which 89% of trips are through traffic). It is understood from the in person consultation that TfNSW is considering a bus lane only on the south side of the bridge – this is insufficient.
The Future Transport Strategy document (PDF) suggests that in the future there could be a rapid bus service that travels between Epping and Macquarie Park. Such a service would likely make use of the bridge. It is unbelievable that a $220 million project is proposed to reduce road congestion without new or improved services (only the 550 is provided) to drive mode shift to public transport (let alone prioritised).
The TfNSW Future Transport Strategy states (page 29):
> Bus lanes and signal priority at intersections provide bus customers with quicker and more reliable journey times, greater customer satisfaction and increased public transport patronage. Transit ways and short bus-only links can provide more direct routes compared with general traffic, reducing journey times, and increasing public transport appeal and patronage. Prioritising more road space for public transport, pedestrians, cycling and micromobility can make cities more efficient and significantly boost economic activity.
In a particularly insightful paragraph, the Transport Impact Assessment (pg 36) concedes the project will not mitigate increased congestion past 2029, but that modal shift to public and active transport could:
> It must be noted that 2039 modelling with proposal has decreased average network speed compared to 2029 without proposal in the PM peak and network delay will increase past 2029 without proposal.
However, this is subject to anticipated growth used in modelling. There is potential that future modal shift, public and active transport, would limit the delay increase.
This paragraph plainly concedes the project will not mitigate increased congestion past 2029, but that modal shift to public and active transport could.
It also acknowledges that mode shift can absorb traffic when it becomes excessive (page 15):
> At some point, forecast traffic growth exceeds the capacity of the upgraded road network, which results in traffic delay. When this delay becomes excessive, it triggers traffic re-routing, mode shift or peak spreading behaviours and an equilibrium is then reached which balances travel utility.
3. Narrow the width of the general traffic lanes
Another busy urban high street, Oxford Street in the City of Sydney (a Classified Road controlled by TfNSW) is being built with 3.0 metre lane widths (an increase from the current 2.5 metre wide lanes), and 3.2 metre bus lanes (under FAQ on the TfNSW project page).
Reducing the width of general traffic lanes (counterintuitively) improves safety by slowing motorists
- A National Investigation on the Impacts of Lane Width on Traffic Safety, Johns Hopkins Bloomberg School of Public Health, 2023 (129 page report): https://narrowlanes.americanhealth.jhu.edu
- Karim, Dewan & Eng, P & PTOE,. (2015). Narrower Lanes, Safer Streets. https://www.researchgate.net/publication/277590178_Narrower_Lanes_Safer_Streets
If design standards do not allow safer, narrower lanes, TfNSW could make use of an “expanded design domain”. This would include a risk assessment including their internal standards team and considering the implications of wider lanes that induce faster driving behaviour that correlates to more frequent crashes. If this solution is not feasible, the risk assessment should be published explaining why. The signposted speed limit may need to be reduced for narrower lane widths (noting the bridge already has a 25 km/h advisory speed limit.
4. Remove the Langston Place slip lane
According to the Queensland Department of Transport and Main Roads as published in their Intersection – Pedestrian Slip lanes fact sheet (PDF) – “For pedestrians with vision impairment, unsignalised slip lanes can be particularly difficult to navigate” & “For drivers, their attention might be focused at oncoming traffic from the right and, therefore, they may fail to observe pedestrians wanting to cross the slip lane.”
Additionally, the Queensland Supplement to Austroads Guide to Road Design Part 4A: Unsignalised and Signalised Intersections document states
> “At intersections on urban roads where people are likely to be walking or cycling, high-entry angle treatments and free-flow acceleration lanes can result in conflict, therefore in such situations consideration should be given to alternative turn treatments. Transport and Main Roads Guideline Selection and Design of Cycle Tracks presents intersection forms which mitigate the risk associated with conflicts for cyclists. If a left-turn slip lane is deemed necessary, it should either be signalised or have a wombat crossing (raised zebra) provided.”
In the Macquarie Park Detailed Precinct Transport Study document:
> The additional pedestrian crossings and removed slip lanes will increase safety and accessibility for walking, cycling and public transport
5. Close High St to through traffic and open it to pedestrians and cyclists
It is understood from the in-person consultation that Transport are considering closing High Street to through traffic. This would improve safety for pedestrians and cyclists travelling along the south side of the bridge and potentially contribute to improving mode share for active transport modes.
Appendix
Assorted errors / issues in the Transport Impact Assessment
Missing 2039 “without proposal” modelling
Table Table 4-1 (Operational Performance With & Without the Proposal) includes a 2039 AM and PM peak “with proposal” calculation for a number of traffic planning metrics, but does not include any “without proposal” numbers.
Austroads suggests 1800 vehicles per lane per hour of green time is an optimistic assumption
The modelling assumes 1800 vehicles per lane, per hour of green-time (Transport Impact Assessment, pg 33).
The 2015 paper “Impacts of On-street Parking on Road Capacity (Sahan Wijayaratna, AECOM Australia) presented at the Australasian Transport Research Forum 2015 states (PDF page 4):
Austroads Guide to Traffic Management Part 3 (2008) states that lane capacity of an urban road under ideal conditions is 1800 vehicles per hour. However a number of factors such as roadway conditions, geometric design, traffic control measures and other physical elements could affect the capacity of a transport corridor. Austroads (2008) has identified the following factors that could influence the capacity of an urban road: traffic lane widths; shoulder widths and/or lateral clearances; design speed; terrain conditions (horizontal and vertical alignment of the road); traffic composition (percentage of heavy vehicles); driver behaviour; control conditions (traffic lights and other traffic management measures); pedestrian and bicycle facilities. To account for these factors Austroads (2008) has provided ‘correction factors’ or adjustment factors when estimating road capacity.
This 1800 figure appears to only be accurate if the lane width is 3.7m (0.7 wider than Oxford St, CoS) and 2 metres of lateral clearance on each side.
“lateral clearance” appears to mean clear width to nearest barrier on each side:
> Lateral clearance is the distance between the extreme edge of the carriageway to the face of the nearest support whether it is a solid abutment, pier or column.
(from https://law.resource.org/pub/in/bis/irc/translate/irc.gov.in.054.1974.html)
Following the provided correction coefficients supplied in this paper after the above paragraph, with 0m lateral clearance, and lanes half way between 2.7m and 3.2 metres (if aiming for 3.0m lanes), Austroads appears to specify capacity as roughly 1800 * ((0.6 + 0.5) /2) = 990 under ideal conditions (without accounting for design speed, terrain conditions, traffic composition, etc.).
This is almost half of the assumed capacity per lane. As we are not traffic engineers we do not have the expertise to understand what (if any) result this would have on the modelling results.
The REF and Transport Impact Assessment claim different LOS metrics for the same intersection
The Review of Environmental Factors and Transport Impact Assessment appears to show conflicting Level of Service metrics for the Bridge Street and Rawson Street intersection performance.
The REF states under table 6-11:
| Bridge Street and Rawson Street | AM Peak Hour | PM Peak Hour | ||||
| 2029 Without Proposal | 2029 With Proposal | 2039 With Proposal | 2029 Without Proposal | 2029 With Proposal | 2039 With Proposal | |
| REF table 6-11 | D | C | C | C | C | E |
| Transport Impact Assessment table 4-2 | E | E | F | D | C | D |
Which is correct? Are other LoS metrics incorrect? They both tell very different stories – that the intersection “improves” in 2029 and then declines in the PM peak, or it doesn’t improve in 2029 and then improves in the PM peak.
The Transport Impact Assessment contains errors referencing LOS metrics
One of the four benefit points for intersection performance appears to be an error
- It states “Intersection performance in the PM peak is forecast to increase from level of service D to E from 2029 opening year to 2039 project year.” (PDF page 37).
- It doesn’t specify which row (which location) has an increased performance.
- Also, a change from LoS D to E is not an improvement (as your grade dropping from a D to E wouldn’t be).
- Additionally, it appears to be comparing “Epping Rd, Blaxland Rd & Langston Plc” 2029 without proposal to 2039 with proposal, which makes no sense at all.
Postscript: Documents on updated modelling
TfNSW summarised and responded to community feedback in the REF Determination Report (2025-05). A “review” of the traffic modelling was carried out, resulting in a revised Transport Impact Assessment. This review …“identified some modelling discrepancies requiring adjustments to model inputs and parameters, as well as opportunities to further optimise future signal coordination”.
TfNSW had not published what input and parameter “adjustments” were made that result in the new modelling predicting an 82.7% higher network speed (AM peak) and 57% drop in average network delay (PM peak) compared to the previous modelling, so I asked. I did not receive any response until making a Government Information Public Access (GIPA) application. I retracted my initial application and filed a second after reading “This revision of the technical note included updates to the calibration of the SIDRA modelling documented in Section 4.3, in response to TfNSW comments raised on 11 February 2025”.
Newly released documents include:
“It has come to our attention that a 2039 “Do Minimum” (without project) scenario has not been modelled
It appears the vector for such attention was this blog post (and associated formal submission on behalf of Better Streets). It also mentions:
…The REF may therefore be in error.
Email, 2025-02-11. GIPA 26T-0120, page 2. (emphasis mine)
The GIPA officer acknowledges my advocacy: that I am a “community advocate regarding the transport network”, and that I “have contributed towards community consultation on issues of importance to members of the public” – which I quote below.
Newly released documents
- 2025-07-27 Email response from project team: files.jakecoppinger.com/epping-bridge/2025-07-27 Email – RE – Epping Bridge transport modelling concerns – Jake Coppinger.pdf
- Attachment: Appendix A, Base Year Technical Note, dated 17 March 2025 (Rev D OFFICIAL, 703100907, EBP150523-MOTTM-EPG-TP-RPT-000001): files.jakecoppinger.com/epping-bridge/Appendix+A+-+Base+Year+Model+Technical+Note.pdf
- TfNSW GIPA 26T-0120
- Notice of decision: files.jakecoppinger.com/epping-bridge/26T-0120%20Decision%20(redacted).pdf
- Information for release (files.jakecoppinger.com/epping-bridge/26T-0120+Information+for+release.pdf), including:
- Email from TfNSW to Mott Macdonald, dated 11 February 2025
- Base Year Technical Note, dated 25 July 2025 (Rev C OFFICIAL, Rev C OFFICIAL, EBP150523-MOTTM-EPG-TP-RPT-000001)
- Options Testing Technical Note, dated 9 April 2025 (Rev E OFFICIAL, 703100907, EBP150523-MOTTM-EPG-TF-RPT-000004)
2025-07-27 Email from project team
From files.jakecoppinger.com/epping-bridge/2025-07-27%20Email%20-%20RE%20-%20Epping%20Bridge%20transport%20modelling%20concerns%20-%20Jake%20Coppinger.pdf
Note: Included hyperlinks are original – some are broken as URLs have slightly changed. See web.archive.org to view these links.
Parramatta [email protected]
17 July 2025 at 15:59
To: Jake Coppinger [email protected]
Cc: Parramatta [email protected]
Dear Jake,
Thank you for your further feedback on the Epping Bridge Project and for your questions regarding the Transport Impact Assessment and refined modelling. Our responses are as below.
Q1) What modal shift assumptions have been made?
The mode shift assumptions and assumed future external network upgrades did not change as part of the recent model update.
Q2) Which modelling inputs were changed? How were they changed?
The changes to the VISSIM modelling were mostly operational in nature. Additional ‘Do Minimum’ scenario for 2039 was also developed to address previous public concerns regarding inaccuracies in the travel time savings assessment. The changes focused on optimisation of signal timings and traffic signal coordination. These optimisation strategies were suggested by the TfNSW signals team, to maximise the future benefits of the proposal. Additionally, the TfNSW modelling team adopted some minor updates and modifications were made to resolve discrepancies to the model coding of some node/link arrangements, where traffic behaviour was not performing as would be expected.
Further information on the refined modelled traffic data can be found in the updated Transport Impact Assessment and section 3 of the Determination Report. Section 3 of the Determination Report provides a summary of the changes between the original and refined modelling.
Q3) Which modelling parameters were changed? How were they changed?
As above, the modelling parameters that changed included signal timings and traffic signal coordination, additionally model coding of some mode/link arrangements were adjusted.
Q4) Which “future network upgrades within the surrounding network” were included in the updated modelling?
The mode shift assumptions and assumed future external network upgrades did not change as part of the recent model update. Any mode shift or route choice expected through the study area were captured in the underlying forecasts derived from the 2021_ STFM_STD model, dated 23/10/2023 (TZP22STMV3.91). These forecasts were not changed as part of the recent model update.
Please refer to pages 67-68 within the attached Appendix A: Base Year Model Technical Note for more information.
Q5) Have any bus lane changes been made in such modelling?
No changes were made to the bus lane assumptions in the recent model update.
Q6) Given the NSW legislation to reduce carbon emissions, and the latest reports showing that target is not on track, how does TfNSW reconcile the project outcome of increasing VKT?
The main reason for the increase in Vehicle Kilometres Travelled (VKT) is due to the constraints of the road network. Epping Bridge is the only rail crossing point in the precinct, so there is little to no route choice. An increase in network capacity, in this instance, results in more trips passing through model, which leads to increased VKT. It is important to remember that VKT alone is not a good measure of the proposal outcomes. The primary benefits of the proposal include:
- increased road capacity, improved traffic flow and travel times
- improved road safety
- improved connectivity to Epping Town Centre, Epping Station and bus interchange for all modes of transport
- enhanced pedestrian and cyclist safety and mobility
- reduced bridge maintenance and operational costs.
- Increased Safety in Rail Operations
- Increased Rail Corridor maintenance efficiency.
The aim of the Epping Bridge Project is to replace the existing bridge with a new, wider bridge that would unlock vital road capacity and keep the approximately 63,000 vehicles that use the bridge each day moving quickly, safely and efficiently.
Overall, the refined traffic modelling of the road network and performance analysis of key intersections found that the project would generally improve or maintain traffic movements both the 2029 and 2039 AM and PM peak periods. Key outcomes of the updated traffic data from the proposal include:
- improvements in all network performance indicators (including average speed, average vehicle delay, completed trips, unreleased trips and average number of vehicle stops) in both the 2029 and 2039 AM and PM peaks
- reduced travel times in both the 2029 and 2039 PM peak periods, including time savings of eight minutes and 52 seconds in 2029 and 13 minutes 49 seconds in 2039 for the Beecroft Road to Blaxland Road southbound route
- reduced travel times for all routes in 2029 and reduced travel times in 2039 excluding the Carlingford Road and Epping Road westbound route which will experience a minor increase in travel time in 2039
- increased or maintained intersection Level of Service for all intersections in both the 2029 and 2039 AM and PM peak periods.
Transport sent a formal response to Better Streets Australia’ssubmission on Tuesday 24 June. A response to Better Streets Australia’s submission can also be found in Section 2.3, Table 2.2 Response to other stakeholder submissions within the Determination Report and specifically on pages 53-56.
We hope this additional information is of assistance and thank you for your interest in the project.
For further information on the Epping Bridge Project please visit the project webpage and interactive portal.
Thank you again for your feedback and interest in the Epping Bridge Project.
Kind regards,
Epping Bridge Project
Parramatta and Cumberland Place team, Central River City
Sydney Integration & Place
Planning, Integration & Passenger
Transport for NSW
Extract from GIPA 26T-0120 Notice of Decision
4.6 In addition to the general public interest in favour of disclosure, I find the following considerations in favour of disclosure relevant to your application:
- Disclosure of the information could reasonably be expected to inform the
public about the traffic modelling considerations, analysis and discussion
between TfNSW and Mott Macdonald for the Epping Bridge Project.4.7 I have applied moderate weight to this consideration in favour of disclosure, noting that there is interest generally in infrastructure projects that affect local communities in NSW. In the case of the Epping Bridge Project, disclosure of the associated traffic modelling considerations, analysis and discussion would inform the public of the underlying data that was used to support agency decision-making (being the concept design of the new Epping Bridge) as seen in the Traffic Impact Assessment.
Extract from Notice of decision, GIPA 26T-0120, Senior Advisor, Access Applications. Emphasis mine.
Personal factors of the application
4.8 Under section 55 of the GIPA Act, I can also take into account any personal factors of your application. I have considered that you are a community advocate regarding the transport network and that you have contributed towards community consultation on issues of importance to members of the public.
Further reading
- Epping Bridge Project Page: https://www.transport.nsw.gov.au/projects/current-projects/epping-bridge-project
- Epping Bridge Concept Design Transport Impact Assessment, August 2024: https://media.caapp.com.au/pdf/6mywbd/23d13968-a703-467c-9933-917612014f55/Transport%20Impact%20Assessment.pdf
- Review of Environmental Factors: https://www.transport.nsw.gov.au/system/files/media/documents/2024/Epping-Bridge-Project-Review-of-Environmental-Factors.pdf
- Transport Impact Assessment
- 2025-08-24: Epping Bridge Concept Design Transport Impact Assessment, Rev C: https://media.caapp.com.au/pdf/6mywbd/23d13968-a703-467c-9933-917612014f55/Transport%20Impact%20Assessment.pdf (https://media.caapp.com.au/6mywbd.pdf)
- 2025-08-24: Epping Bridge Concept Design Transport Impact Assessment, Rev E: https://www.transport.nsw.gov.au/system/files/media/documents/2025/Epping-Bridge-Transport-Impact-Assessment-Revised-May-2025_1.pdf
- Chris Topher YouTube video, 23 Apr 2023: Epping Road Bridge does NOT need Widening (CONSULTATION OPEN SEP-OCT 2024)
- Alan Mascarenhas tweet regarding the bridge: https://archive.is/7Lee4 (https://x.com/alanmasc/status/1639105012231192577)
- August 2014 TfNSW map titled “Epping Town Centre Road and Intersection Improvements”: https://www.transport.nsw.gov.au/sites/default/files/media/documents/rww/projects/01documents/epping-town-centre/epping-town-centre-community-map-august-2014.pdf
- “Epping Town Centre road and intersections upgrades. Project 2, Epping Road upgrade between Blaxland Road and Essex Street, Epping : community consultation report”: https://nla.gov.au/nla.obj-319321429/view
- “Transcript – Press conference – Epping Bridge, Sydney”. Joint media release: Jerome Laxale MP, Member for Bennelong, Joint Release with The Hon Jo Haylen MP NSW Transport Minister. https://minister.infrastructure.gov.au/c-king/interview/transcript-press-conference-epping-bridge-sydney
- “Sydney motorists to be promised $220m upgrade for Epping Station bottleneck”, Sydney Morning Herald. https://www.smh.com.au/politics/federal/sydney-motorists-to-be-promised-220m-upgrade-for-epping-station-bottleneck-20220509-p5aju7.html
- 2025-07-27 Email response from project team: files.jakecoppinger.com/epping-bridge/2025-07-27 Email – RE – Epping Bridge transport modelling concerns – Jake Coppinger.pdf
- Attachment: Appendix A, Base Year Technical Note, dated 17 March 2025 (Rev D OFFICIAL, 703100907, EBP150523-MOTTM-EPG-TP-RPT-000001): files.jakecoppinger.com/epping-bridge/Appendix+A+-+Base+Year+Model+Technical+Note.pdf
- TfNSW GIPA 26T-0120
- Notice of decision: files.jakecoppinger.com/epping-bridge/26T-0120%20Decision%20(redacted).pdf
- Information for release (files.jakecoppinger.com/epping-bridge/26T-0120+Information+for+release.pdf), including:
- Email from TfNSW to Mott Macdonald, dated 11 February 2025
- Base Year Technical Note, dated 25 July 2025 (Rev C OFFICIAL, Rev C OFFICIAL, EBP150523-MOTTM-EPG-TP-RPT-000001)
- Options Testing Technical Note, dated 9 April 2025 (Rev E OFFICIAL, 703100907, EBP150523-MOTTM-EPG-TF-RPT-000004)
Leave a Reply